$MEGA 🚀 Keep an eye on the MEGA/USDT chart!
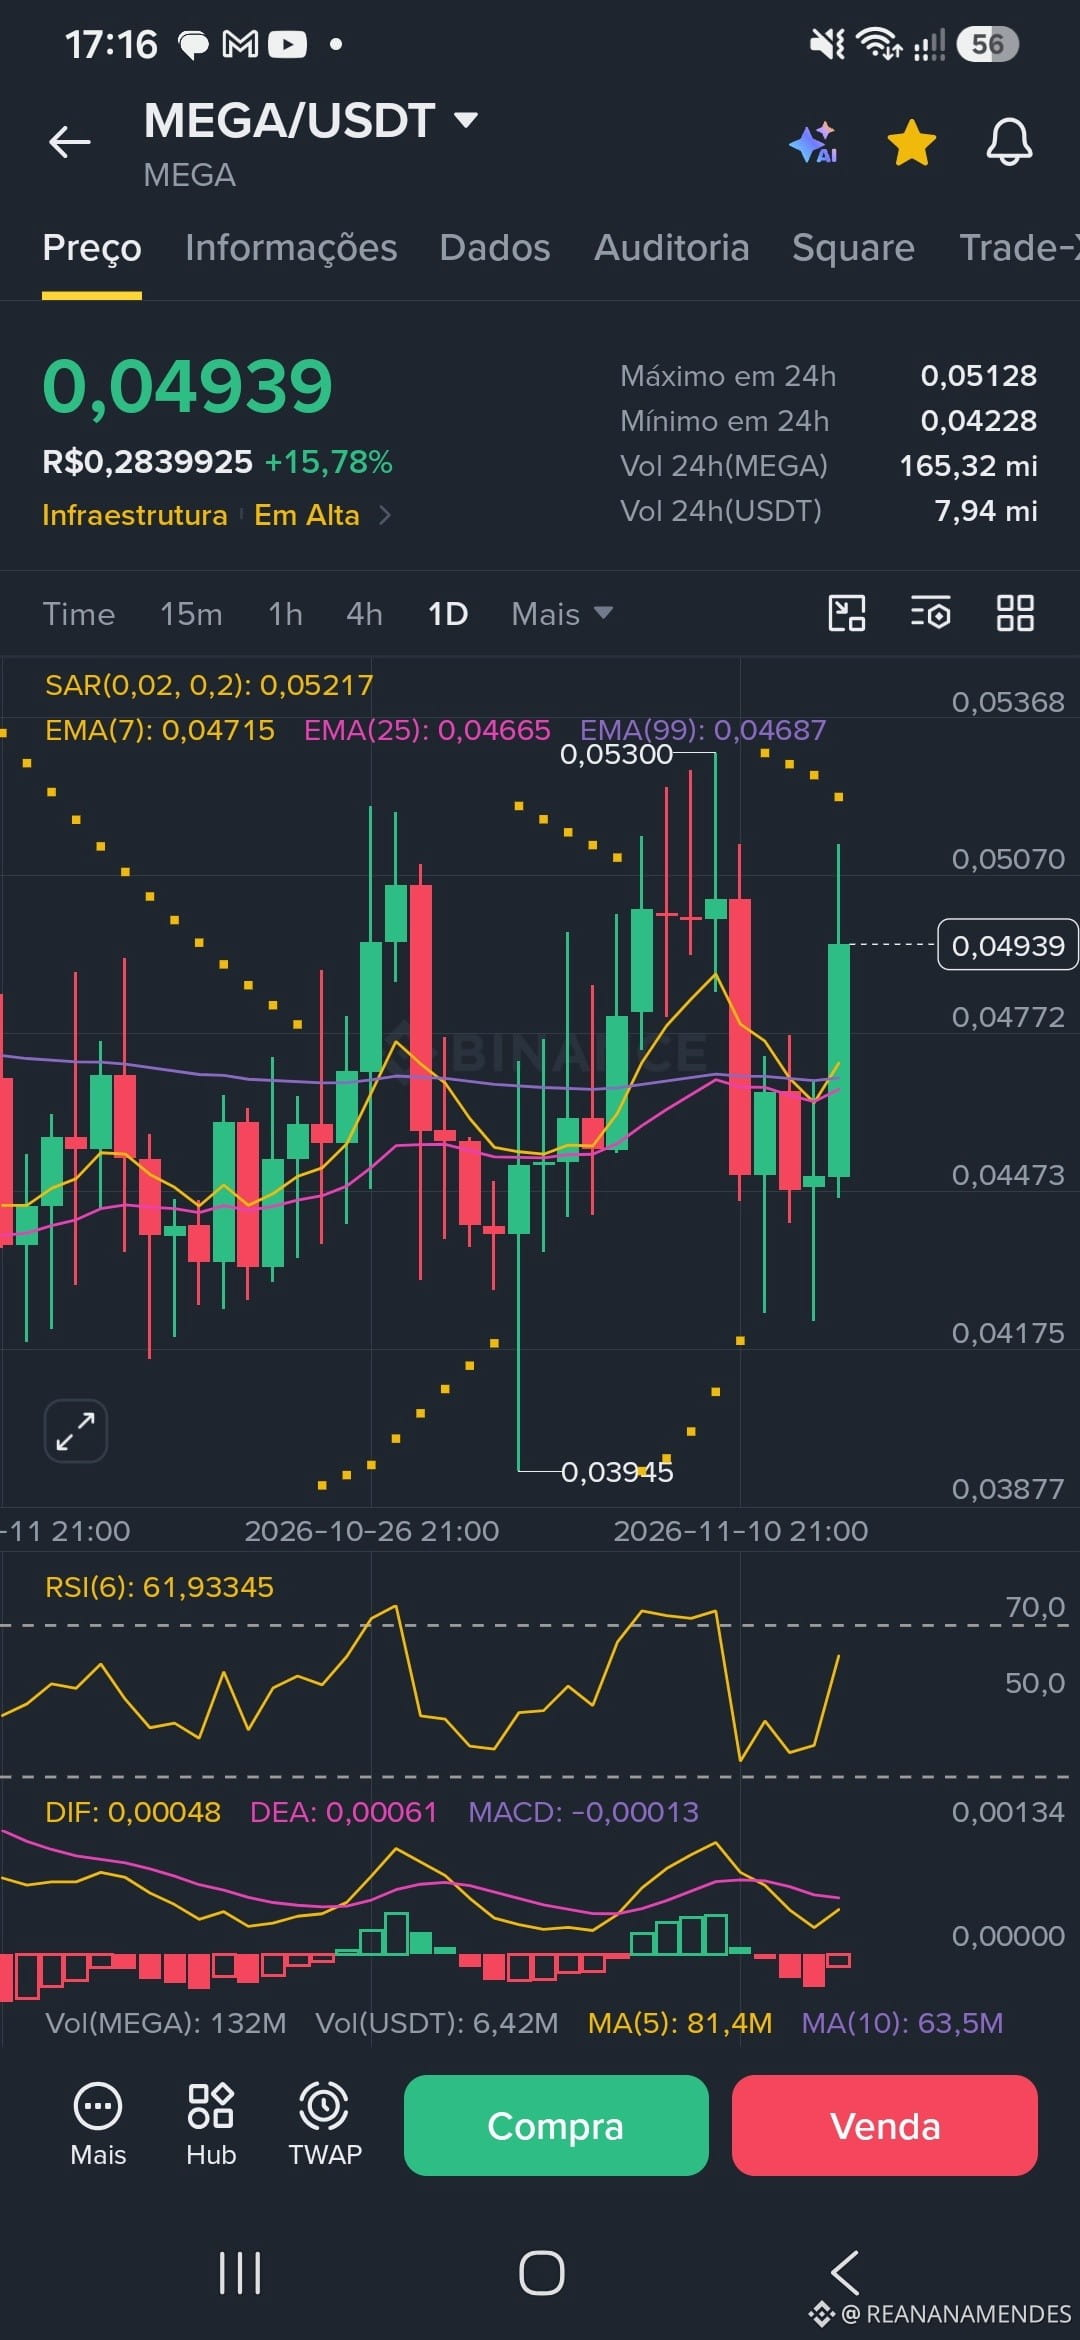
The asset is showing an interesting recovery on the daily chart (1D), posting a gain of +15.78% and trading at 0.04939 USDT (approximately R$ 0.28).
Looking at the current technical indicators:
Moving Averages (EMA): The EMA(7) at 0.04715 is crossing above the reference lines, indicating short-term bullish momentum.
RSI (6): Around 61.93, showing buying strength in the market, but still far from an extreme overbought zone.
Volume: Strong activity over the last 24 hours, with notably high trading volume.
Will MEGA try to test the 0.05300 resistance again in the coming days?
The asset is showing an interesting recovery on the daily chart (1D), posting a gain of +15.78% and trading at 0.04939 USDT (approximately R$ 0.28).
Looking at the current technical indicators:
Moving Averages (EMA): The EMA(7) at 0.04715 is crossing above the reference lines, indicating short-term bullish momentum.
RSI (6): Around 61.93, showing buying strength in the market, but still far from an extreme overbought zone.
Volume: Strong activity over the last 24 hours, with notably high trading volume.
Will MEGA try to test the 0.05300 resistance again in the coming days?