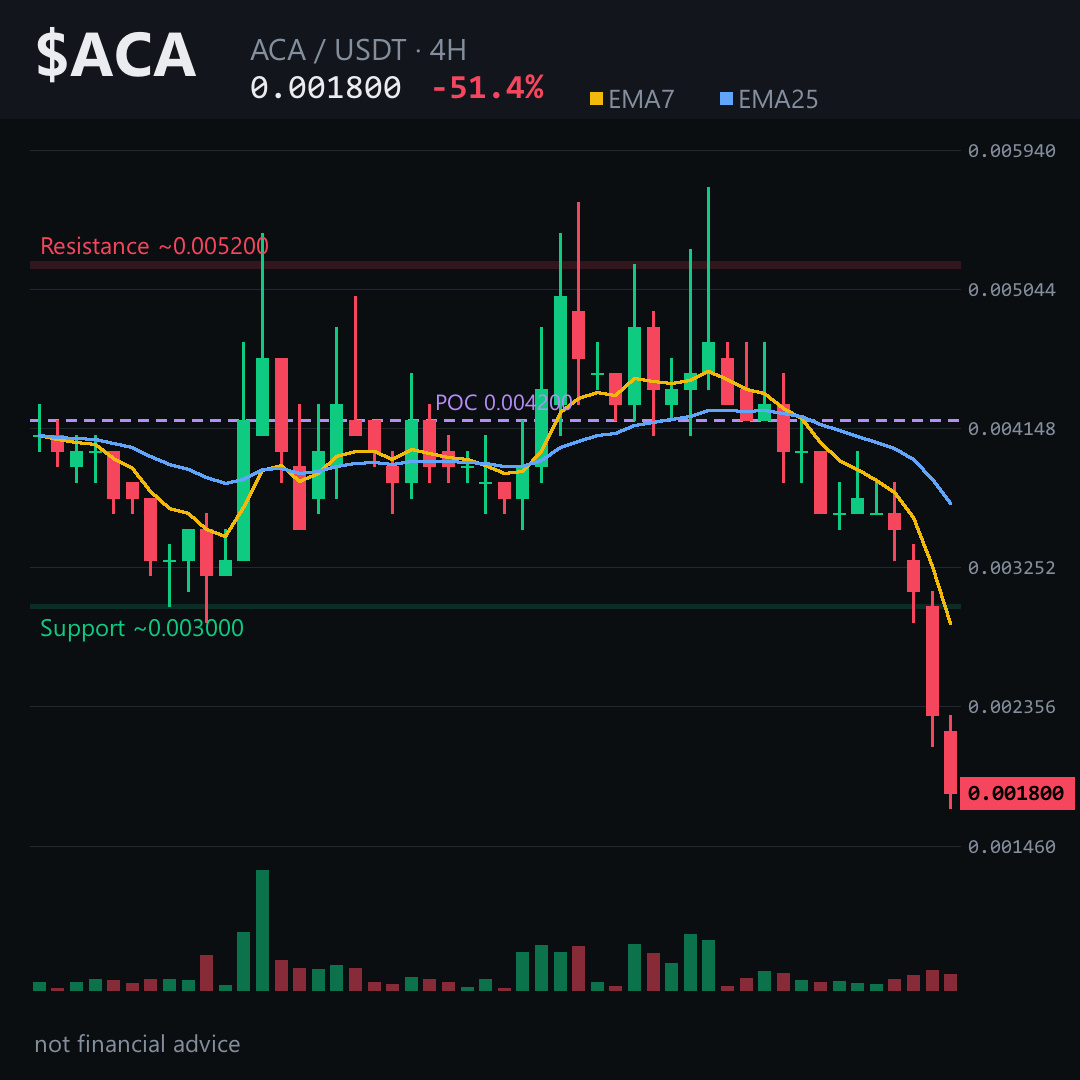
Imagine watching a slow leak in a dam for two days, then suddenly the whole wall gives way. That’s $ACA right now — a 51% single-day collapse, and the chart is still bleeding.
Every bounce over the last 48 hours got sold. Price fell from the low 0.004s to 0.0017 in a handful of candles. 4H EMAs are stacked bearish, RSI is buried near 23, and an unfilled gap sits just above between roughly 0.0031 and 0.0033 — rallies into that zone have historically been exits, not entries.
Here’s the level I’m watching most closely: the ~0.0019 area. If $ACA can’t reclaim that on a 4H close, the path of least resistance stays down toward 0.00165, and possibly lower. Lose the current lows near 0.0017 and there isn’t much structural support until the macro objective around 0.00114.
My read: this is a falling knife with no meaningful futures positioning to cushion it — funding is flat and open interest is essentially zero, so there’s no short squeeze fuel here. The risk isn’t missing a bounce; it’s catching one that never comes. Tap $ACA to pull up the chart and see the gap yourself.
I’ll be watching whether the 0.0019 area gets tested and rejected — follow along and I’ll share what the next 4H close tells us. Which level are you trusting more right now on ACA 👇
⚠️ Not financial advice. DYOR.
#ACA #Acala #Crypto #BinanceSquare
Every bounce over the last 48 hours got sold. Price fell from the low 0.004s to 0.0017 in a handful of candles. 4H EMAs are stacked bearish, RSI is buried near 23, and an unfilled gap sits just above between roughly 0.0031 and 0.0033 — rallies into that zone have historically been exits, not entries.
Here’s the level I’m watching most closely: the ~0.0019 area. If $ACA can’t reclaim that on a 4H close, the path of least resistance stays down toward 0.00165, and possibly lower. Lose the current lows near 0.0017 and there isn’t much structural support until the macro objective around 0.00114.
My read: this is a falling knife with no meaningful futures positioning to cushion it — funding is flat and open interest is essentially zero, so there’s no short squeeze fuel here. The risk isn’t missing a bounce; it’s catching one that never comes. Tap $ACA to pull up the chart and see the gap yourself.
I’ll be watching whether the 0.0019 area gets tested and rejected — follow along and I’ll share what the next 4H close tells us. Which level are you trusting more right now on ACA 👇
⚠️ Not financial advice. DYOR.
#ACA #Acala #Crypto #BinanceSquare