
📉 $INIT SIGNAL: Bearish Rejection Setup — Is Another Downward Move Developing?
🎯 SIGNAL | $INIT/USDT | 1H
Entry: $0.11915
Stop Loss: $0.12468
Take Profit: $0.10195
Risk-to-Reward Ratio: Approximately 1:3.1
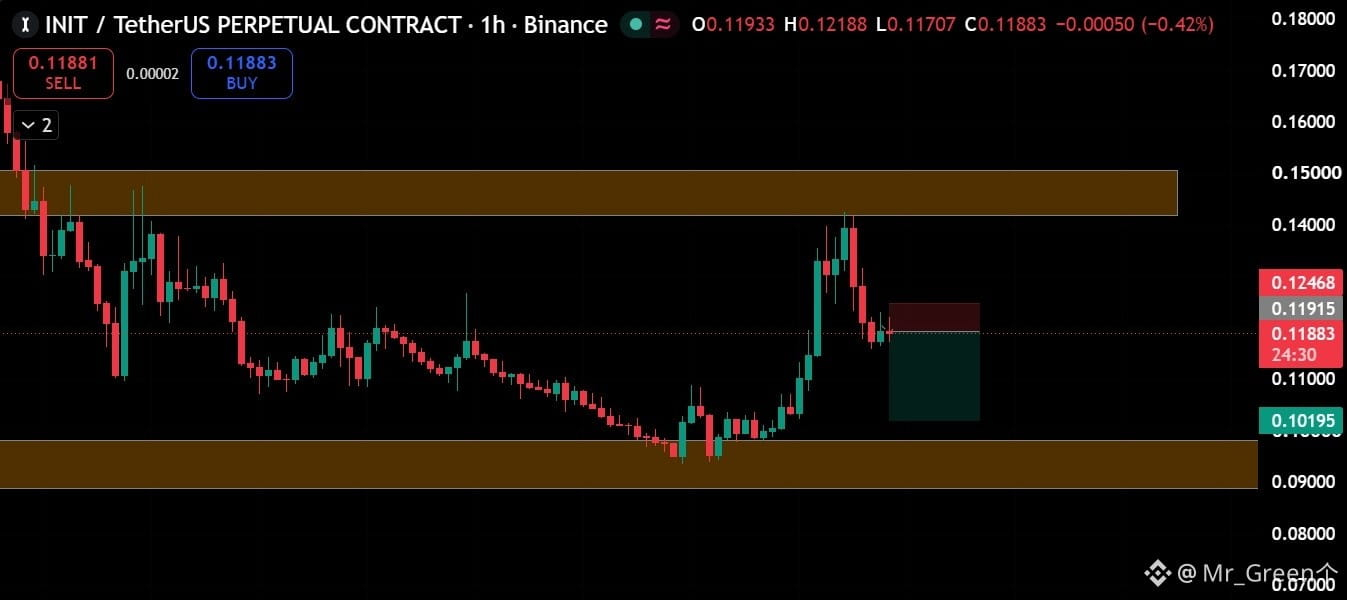
The chart highlights a potential short setup near $0.11915, with a downside objective around $0.10195. The setup remains conditional on bearish confirmation, as renewed buying pressure could invalidate the expected move.
📊 MARKET ANALYSIS
INIT is trading around $0.11883 on the Binance 1H chart, following a sharp rejection from the $0.140–$0.150 resistance zone.
The recent price action tells an interesting story. After declining toward the $0.095 support region, INIT staged an aggressive recovery toward $0.140. However, the rally quickly lost momentum as price approached a historically important supply area.
The rejection pushed INIT back toward $0.119, suggesting sellers remain active at higher levels. The rapid reversal indicates weakening short-term bullish momentum, although the broader recovery has not yet been completely invalidated.
The $0.142–$0.150 region remains an important overhead resistance area, while $0.102 and $0.090–$0.100 represent potential downside support zones.
⚠️ MY TAKE
I currently favor a cautious bearish outlook while INIT remains below the immediate resistance area.
The sharp recovery followed by aggressive rejection suggests that sellers are defending higher prices. However, the current consolidation near $0.119 means confirmation is still important.
A sustained breakdown below the current price region could open the way toward $0.110 and potentially $0.102. On the other hand, a move above $0.12468 would invalidate the immediate bearish setup.
For now, I am watching whether sellers can maintain control or whether buyers regain momentum.
Do you think INIT will revisit the $0.102 support zone, or could another bullish recovery develop?
#INIT #CryptoAnalysis #BinanceFutures #TradingSignals #BinanceSquare
Not financial advice. DYOR.
🎯 SIGNAL | $INIT/USDT | 1H
Entry: $0.11915
Stop Loss: $0.12468
Take Profit: $0.10195
Risk-to-Reward Ratio: Approximately 1:3.1
The chart highlights a potential short setup near $0.11915, with a downside objective around $0.10195. The setup remains conditional on bearish confirmation, as renewed buying pressure could invalidate the expected move.
📊 MARKET ANALYSIS
INIT is trading around $0.11883 on the Binance 1H chart, following a sharp rejection from the $0.140–$0.150 resistance zone.
The recent price action tells an interesting story. After declining toward the $0.095 support region, INIT staged an aggressive recovery toward $0.140. However, the rally quickly lost momentum as price approached a historically important supply area.
The rejection pushed INIT back toward $0.119, suggesting sellers remain active at higher levels. The rapid reversal indicates weakening short-term bullish momentum, although the broader recovery has not yet been completely invalidated.
The $0.142–$0.150 region remains an important overhead resistance area, while $0.102 and $0.090–$0.100 represent potential downside support zones.
⚠️ MY TAKE
I currently favor a cautious bearish outlook while INIT remains below the immediate resistance area.
The sharp recovery followed by aggressive rejection suggests that sellers are defending higher prices. However, the current consolidation near $0.119 means confirmation is still important.
A sustained breakdown below the current price region could open the way toward $0.110 and potentially $0.102. On the other hand, a move above $0.12468 would invalidate the immediate bearish setup.
For now, I am watching whether sellers can maintain control or whether buyers regain momentum.
Do you think INIT will revisit the $0.102 support zone, or could another bullish recovery develop?
#INIT #CryptoAnalysis #BinanceFutures #TradingSignals #BinanceSquare
Not financial advice. DYOR.