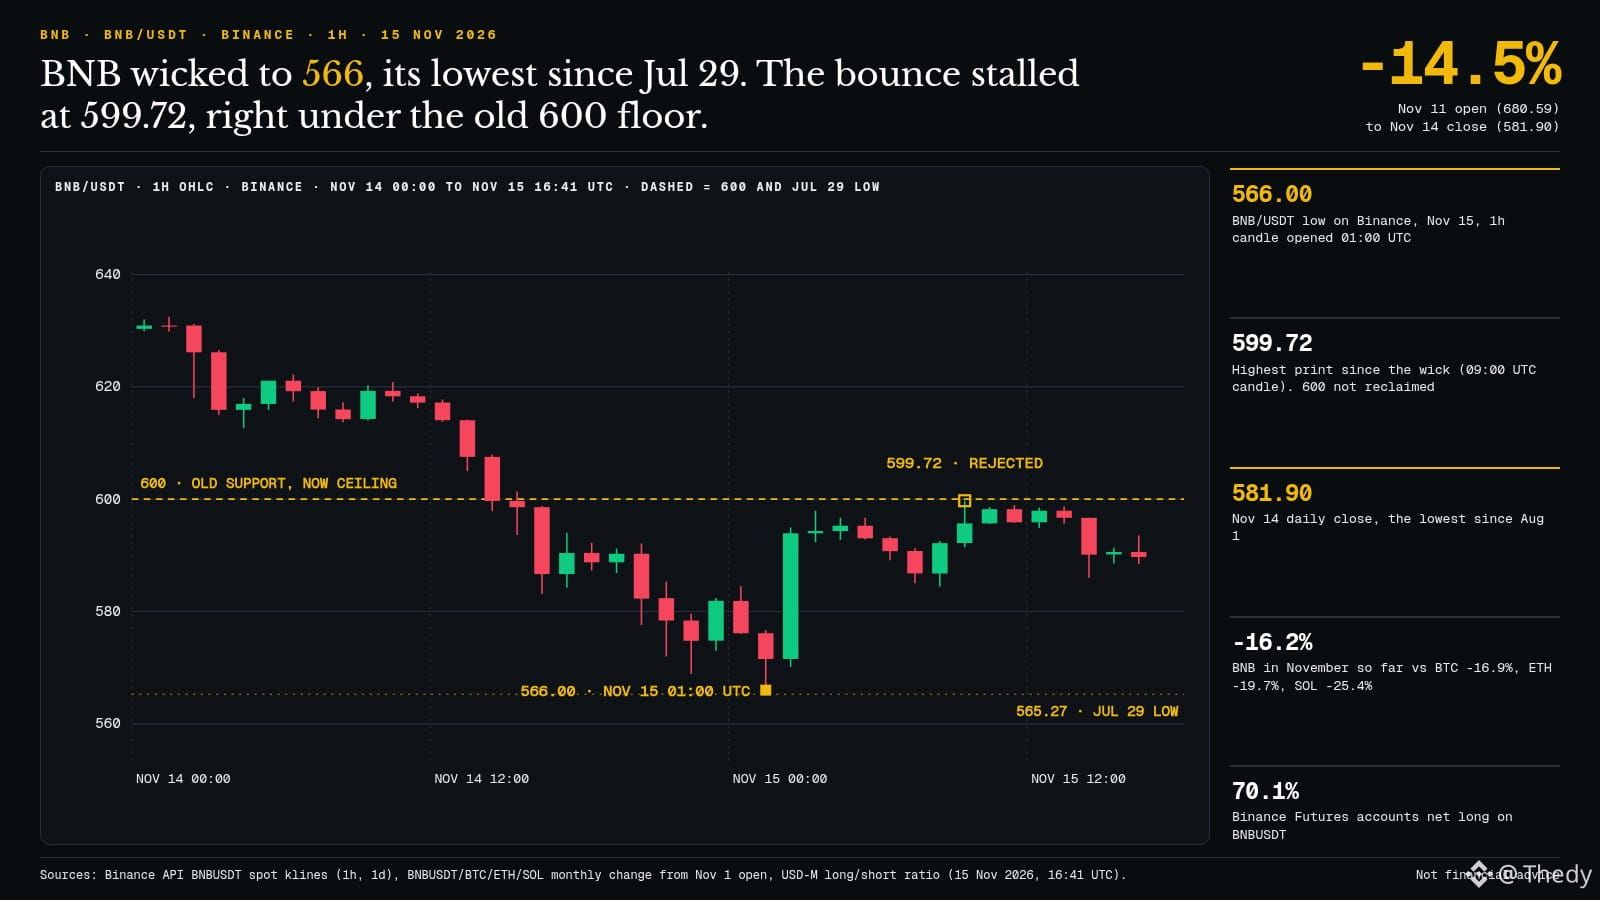
$BNB a wicked down to $566 on Binance overnight (15/11, 01:00 UTC 1h candle), its lowest since July 29. And the rebound that followed stopped right below the old $600 floor.
That’s what the hourly candlestick chart shows. Yesterday, the $600 zone gave way for the first time since August. Overnight, after the wick down to 566, BNB recovered more than 5% in two hours, then hit resistance twice below that level: $597.94 around 03:00 UTC, then $599.72 on the 09:00 UTC candle. Not a single hourly close above $600 since. At 16:41 UTC, it’s back around $589.78.
The daily close on 14/11 at $581.90 was the lowest since August 1. Between the 11/11 open ($680.59) and that close, BNB lost 14.5% in four sessions.
In November, it’s down 16.2% from the month’s open, compared with -16.9% for $BTC , -19.7% for $ETH and -25.4% for SOL. It’s holding up a little better than the other majors, but hasn’t escaped the decline.
In futures, 70.1% of accounts remain long on BNBUSDT.
My take: when former support rejects the price on the first retest, it often signals that sellers are now defending that level. Until $600 is reclaimed on a closing basis, the rebound is just a rebound. A daily close above it would invalidate this scenario. Conversely, a close below $565 (the July 29 low) would open up a gap that hasn’t been tested since the summer.
Do you see this rejection below $600 as a trap for sellers, or as confirmation that support has become resistance?
#BNB #CryptoMarket
Sources: Binance API BNBUSDT (1h and 1d spot, monthly changes for BTC/ETH/SOL since the 01/11 open, USD-M long/short ratio, 15/11 16:41 UTC). Not financial advice.
That’s what the hourly candlestick chart shows. Yesterday, the $600 zone gave way for the first time since August. Overnight, after the wick down to 566, BNB recovered more than 5% in two hours, then hit resistance twice below that level: $597.94 around 03:00 UTC, then $599.72 on the 09:00 UTC candle. Not a single hourly close above $600 since. At 16:41 UTC, it’s back around $589.78.
The daily close on 14/11 at $581.90 was the lowest since August 1. Between the 11/11 open ($680.59) and that close, BNB lost 14.5% in four sessions.
In November, it’s down 16.2% from the month’s open, compared with -16.9% for $BTC , -19.7% for $ETH and -25.4% for SOL. It’s holding up a little better than the other majors, but hasn’t escaped the decline.
In futures, 70.1% of accounts remain long on BNBUSDT.
My take: when former support rejects the price on the first retest, it often signals that sellers are now defending that level. Until $600 is reclaimed on a closing basis, the rebound is just a rebound. A daily close above it would invalidate this scenario. Conversely, a close below $565 (the July 29 low) would open up a gap that hasn’t been tested since the summer.
Do you see this rejection below $600 as a trap for sellers, or as confirmation that support has become resistance?
#BNB #CryptoMarket
Sources: Binance API BNBUSDT (1h and 1d spot, monthly changes for BTC/ETH/SOL since the 01/11 open, USD-M long/short ratio, 15/11 16:41 UTC). Not financial advice.