$ETH Crypto Academician: 11.16 Ethereum (ETH) Rebound Is Not a Reversal; Stabilizing Is Not Bottoming: What Signals Would Confirm the Next Move?
The first step into spot Ethereum is now available: below 2,000 for the first entry, and 1,500 for the second. For now, focus on the trade planned before the market opened; stick to the intraday trading plan. As for futures, watch the order book first. This pullback from the highs has been very fast, leaving many people trapped halfway down. The worst thing now is to get carried away emotionally and rush to make your money back. The market won’t move in your favor just because you’re in a hurry. The daily chart is still in a bearish alignment; the four-hour chart is just catching its breath after falling too far. Don’t mistake a rebound for a reversal. I also tried going long three times and was stopped out each time. A stop-loss isn’t admitting defeat; it keeps the door open for your next entry. The market never runs out of opportunities; what’s scarce is capital and patience.
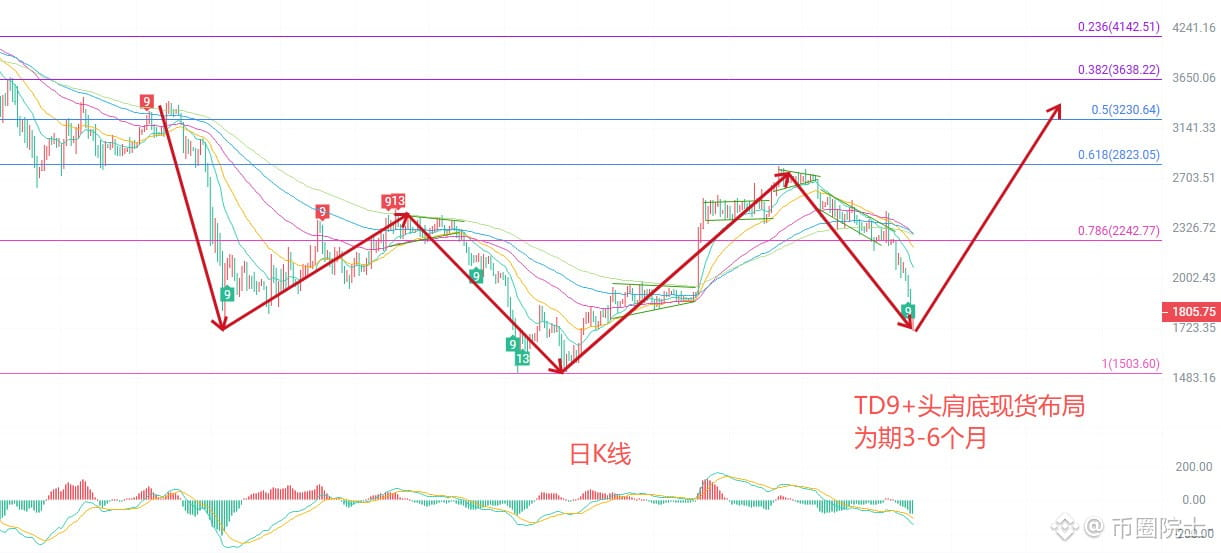
The daily candlestick is a recovery bullish candle following a sharp decline. For the moving averages, EMA15 is at 2070, EMA30 at 2199, and EMA60 at 2291. Price is below all of them, so the medium-term alignment remains bearish. For now, the rebound can only be viewed as a recovery after the decline. The MACD lines are below the zero line and opening downward, with no clear turn in trend momentum yet. The Bollinger Band middle line is at 2164, the upper band at 2509, and the lower band at 1819. The current price is tracking close to the lower band, showing short-term oversold conditions but not yet a breakout from the channel. Overall, the daily chart remains weak. Watch whether price can recover the 1844 level with increased volume and move back above the short-term moving averages; otherwise, a second bottom test remains possible after the rebound.
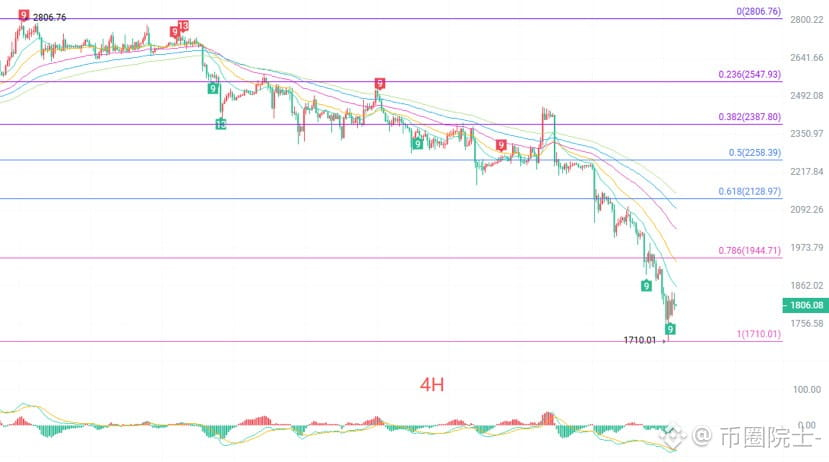
On the four-hour chart, the moving averages are EMA15 at 1868, EMA30 at 1940, and EMA60 at 2039. Price is below EMA15, so the shorter-term trend is also bearish, with the area around 1868 serving as the first resistance to a rebound. The MACD lines are below the zero line, but the green bars have narrowed noticeably compared with the previous period, indicating that selling momentum has eased and that initial signs of stabilization are appearing at the lows. However, there has not yet been a bullish crossover to confirm a reversal. 1745 is near-term support at the lower channel. The four-hour chart looks more like consolidation after a sharp decline. The market’s direction still depends on the moving averages converging or a breakout on increased volume, so it is too early to treat this rebound as a reversal.
Short-term reference:
If price rises into 1840–1880 and momentum stalls, use a 30-point stop-loss; targets are 1850–1800, with 1750 in view if support breaks.
If price pulls back to 1745–1710, the area between the lower Bollinger Band and the previous low, and shows signs of stabilizing, it can be watched as a potential long-entry zone. Place the stop-loss below the 1700 round-number level; initial targets are 1808–1841.
#ETH合约
The first step into spot Ethereum is now available: below 2,000 for the first entry, and 1,500 for the second. For now, focus on the trade planned before the market opened; stick to the intraday trading plan. As for futures, watch the order book first. This pullback from the highs has been very fast, leaving many people trapped halfway down. The worst thing now is to get carried away emotionally and rush to make your money back. The market won’t move in your favor just because you’re in a hurry. The daily chart is still in a bearish alignment; the four-hour chart is just catching its breath after falling too far. Don’t mistake a rebound for a reversal. I also tried going long three times and was stopped out each time. A stop-loss isn’t admitting defeat; it keeps the door open for your next entry. The market never runs out of opportunities; what’s scarce is capital and patience.
The daily candlestick is a recovery bullish candle following a sharp decline. For the moving averages, EMA15 is at 2070, EMA30 at 2199, and EMA60 at 2291. Price is below all of them, so the medium-term alignment remains bearish. For now, the rebound can only be viewed as a recovery after the decline. The MACD lines are below the zero line and opening downward, with no clear turn in trend momentum yet. The Bollinger Band middle line is at 2164, the upper band at 2509, and the lower band at 1819. The current price is tracking close to the lower band, showing short-term oversold conditions but not yet a breakout from the channel. Overall, the daily chart remains weak. Watch whether price can recover the 1844 level with increased volume and move back above the short-term moving averages; otherwise, a second bottom test remains possible after the rebound.
On the four-hour chart, the moving averages are EMA15 at 1868, EMA30 at 1940, and EMA60 at 2039. Price is below EMA15, so the shorter-term trend is also bearish, with the area around 1868 serving as the first resistance to a rebound. The MACD lines are below the zero line, but the green bars have narrowed noticeably compared with the previous period, indicating that selling momentum has eased and that initial signs of stabilization are appearing at the lows. However, there has not yet been a bullish crossover to confirm a reversal. 1745 is near-term support at the lower channel. The four-hour chart looks more like consolidation after a sharp decline. The market’s direction still depends on the moving averages converging or a breakout on increased volume, so it is too early to treat this rebound as a reversal.
Short-term reference:
If price rises into 1840–1880 and momentum stalls, use a 30-point stop-loss; targets are 1850–1800, with 1750 in view if support breaks.
If price pulls back to 1745–1710, the area between the lower Bollinger Band and the previous low, and shows signs of stabilizing, it can be watched as a potential long-entry zone. Place the stop-loss below the 1700 round-number level; initial targets are 1808–1841.
#ETH合约