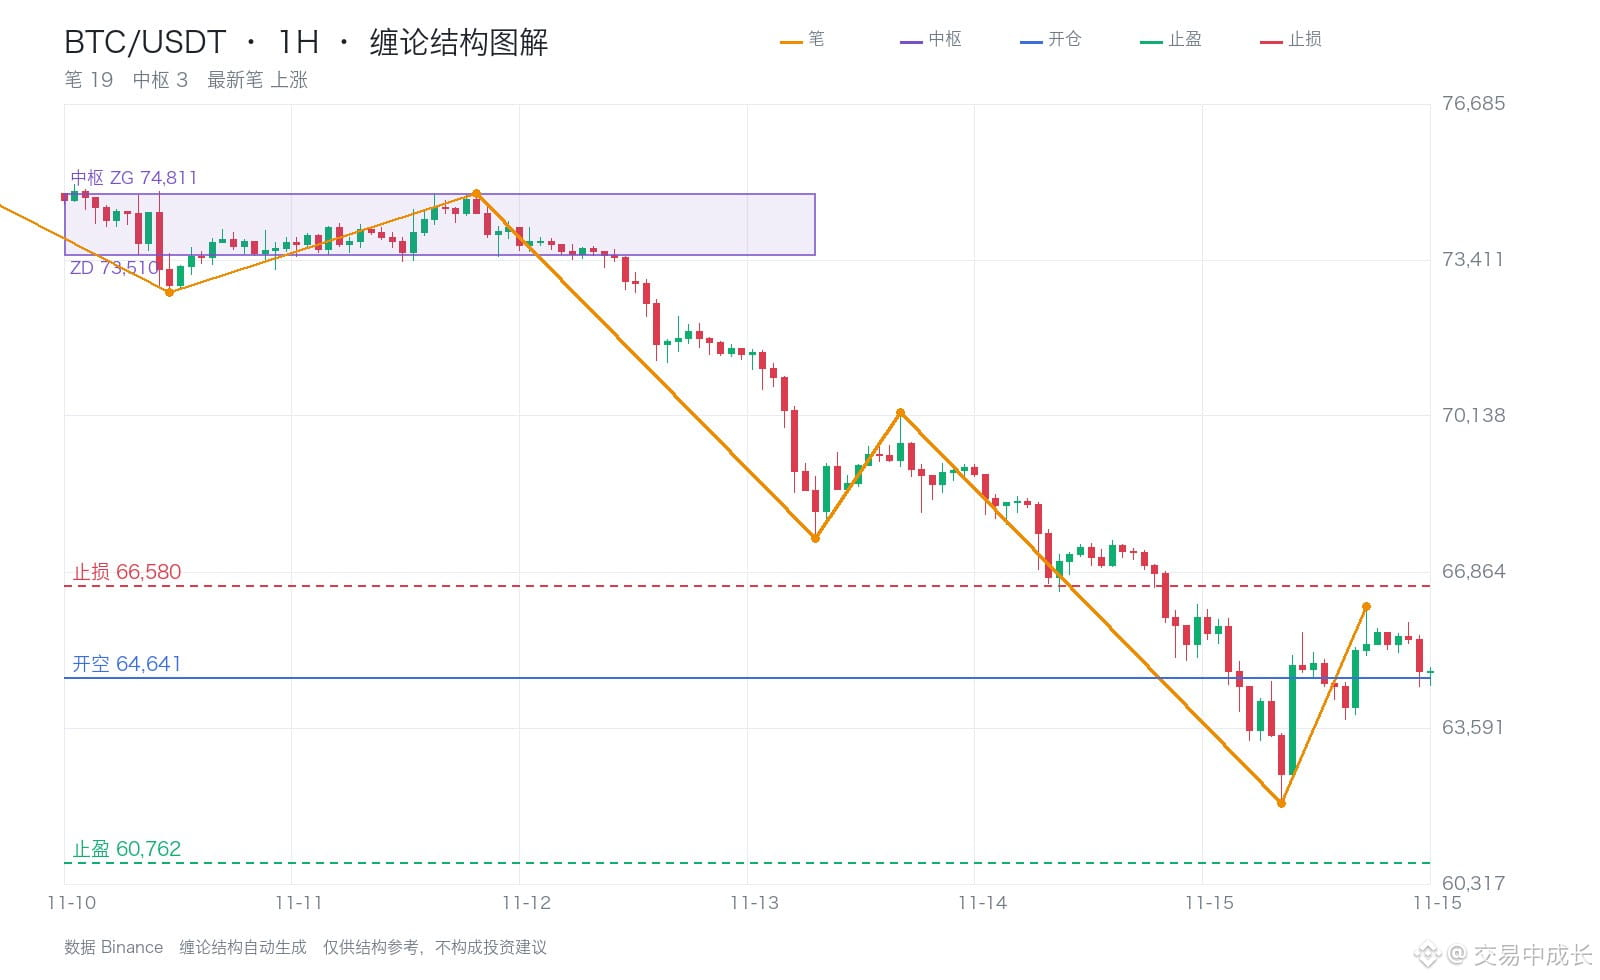
A third-sell signal has appeared on the BTC 1h chart. Short entry: 64,641.
The nearest central zone above is 73,510–74,811. Price broke below it long ago and has continued falling, now about 12% below its lower boundary.
According to Chan Theory, when the first rebound after a break below the central zone fails to re-enter it, that is a third sell—the most textbook short-entry point.
Looking at the next two higher timeframes, both the 4-hour and daily charts are below their respective central zones. The broader trend is aligned to the downside, confirming the third-sell signal.
Stop-loss: 66,580 (about 3.0% risk). Take-profit: 60,762. Limited downside, with room for greater gains.
$BTC $ETH #缠论 #FuturesLiquidation
The nearest central zone above is 73,510–74,811. Price broke below it long ago and has continued falling, now about 12% below its lower boundary.
According to Chan Theory, when the first rebound after a break below the central zone fails to re-enter it, that is a third sell—the most textbook short-entry point.
Looking at the next two higher timeframes, both the 4-hour and daily charts are below their respective central zones. The broader trend is aligned to the downside, confirming the third-sell signal.
Stop-loss: 66,580 (about 3.0% risk). Take-profit: 60,762. Limited downside, with room for greater gains.
$BTC $ETH #缠论 #FuturesLiquidation