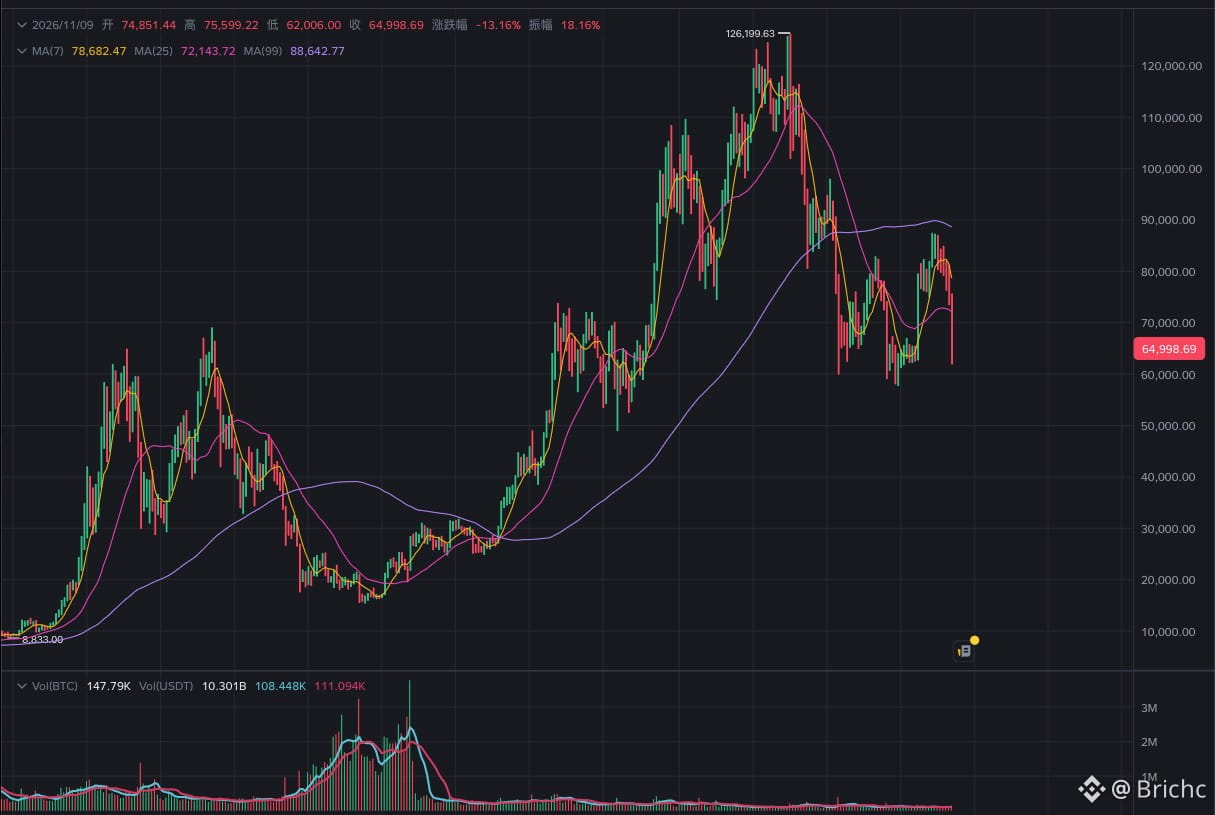
【Bitcoin has fallen to the neckline of a head-and-shoulders pattern. Could its all-time high of $126,000 really have been the top?】
Peter Brandt, the well-known trader and chart analyst who successfully predicted Bitcoin’s 2018 crash, has offered a bearish assessment: the $BTC weekly chart may have formed a large head-and-shoulders pattern. If confirmed, the all-time high of over $126,000 in October 2025 could prove to be a ceiling that remains unbroken for a long time. BTC has now retreated nearly 50% from its high, with its price reaching the $62,000–$65,000 neckline zone. A decisive break below this level could turn the head-and-shoulders pattern from a chart-based hypothesis into a genuine signal of a trend reversal.
The pressure on this level isn’t just coming from the technical chart. U.S. spot Bitcoin ETFs have seen net outflows for seven consecutive trading days, totaling approximately $1.91 billion. BTC fell more than 15% over the past week, and leveraged longs have also faced massive liquidations. The combination of institutional outflows, prices falling below key moving averages, and a concentrated flush-out of leveraged positions is making this downturn look increasingly like a cyclical bear market rather than an ordinary correction.
However, Brandt himself framed his view with the caveat “if the pattern holds.” A head-and-shoulders pattern must break decisively below the neckline to be confirmed. Declaring, based on its current outline alone, that Bitcoin will never reach new highs again would be premature.
The $60,000–$65,000 range is currently the most important battleground between bulls and bears. Holding above it would leave room for a bottom to form; a decisive weekly close below it would mean the market must seriously reckon with a longer-term bear market, rather than treating every rebound as a buying opportunity.
Peter Brandt, the well-known trader and chart analyst who successfully predicted Bitcoin’s 2018 crash, has offered a bearish assessment: the $BTC weekly chart may have formed a large head-and-shoulders pattern. If confirmed, the all-time high of over $126,000 in October 2025 could prove to be a ceiling that remains unbroken for a long time. BTC has now retreated nearly 50% from its high, with its price reaching the $62,000–$65,000 neckline zone. A decisive break below this level could turn the head-and-shoulders pattern from a chart-based hypothesis into a genuine signal of a trend reversal.
The pressure on this level isn’t just coming from the technical chart. U.S. spot Bitcoin ETFs have seen net outflows for seven consecutive trading days, totaling approximately $1.91 billion. BTC fell more than 15% over the past week, and leveraged longs have also faced massive liquidations. The combination of institutional outflows, prices falling below key moving averages, and a concentrated flush-out of leveraged positions is making this downturn look increasingly like a cyclical bear market rather than an ordinary correction.
However, Brandt himself framed his view with the caveat “if the pattern holds.” A head-and-shoulders pattern must break decisively below the neckline to be confirmed. Declaring, based on its current outline alone, that Bitcoin will never reach new highs again would be premature.
The $60,000–$65,000 range is currently the most important battleground between bulls and bears. Holding above it would leave room for a bottom to form; a decisive weekly close below it would mean the market must seriously reckon with a longer-term bear market, rather than treating every rebound as a buying opportunity.