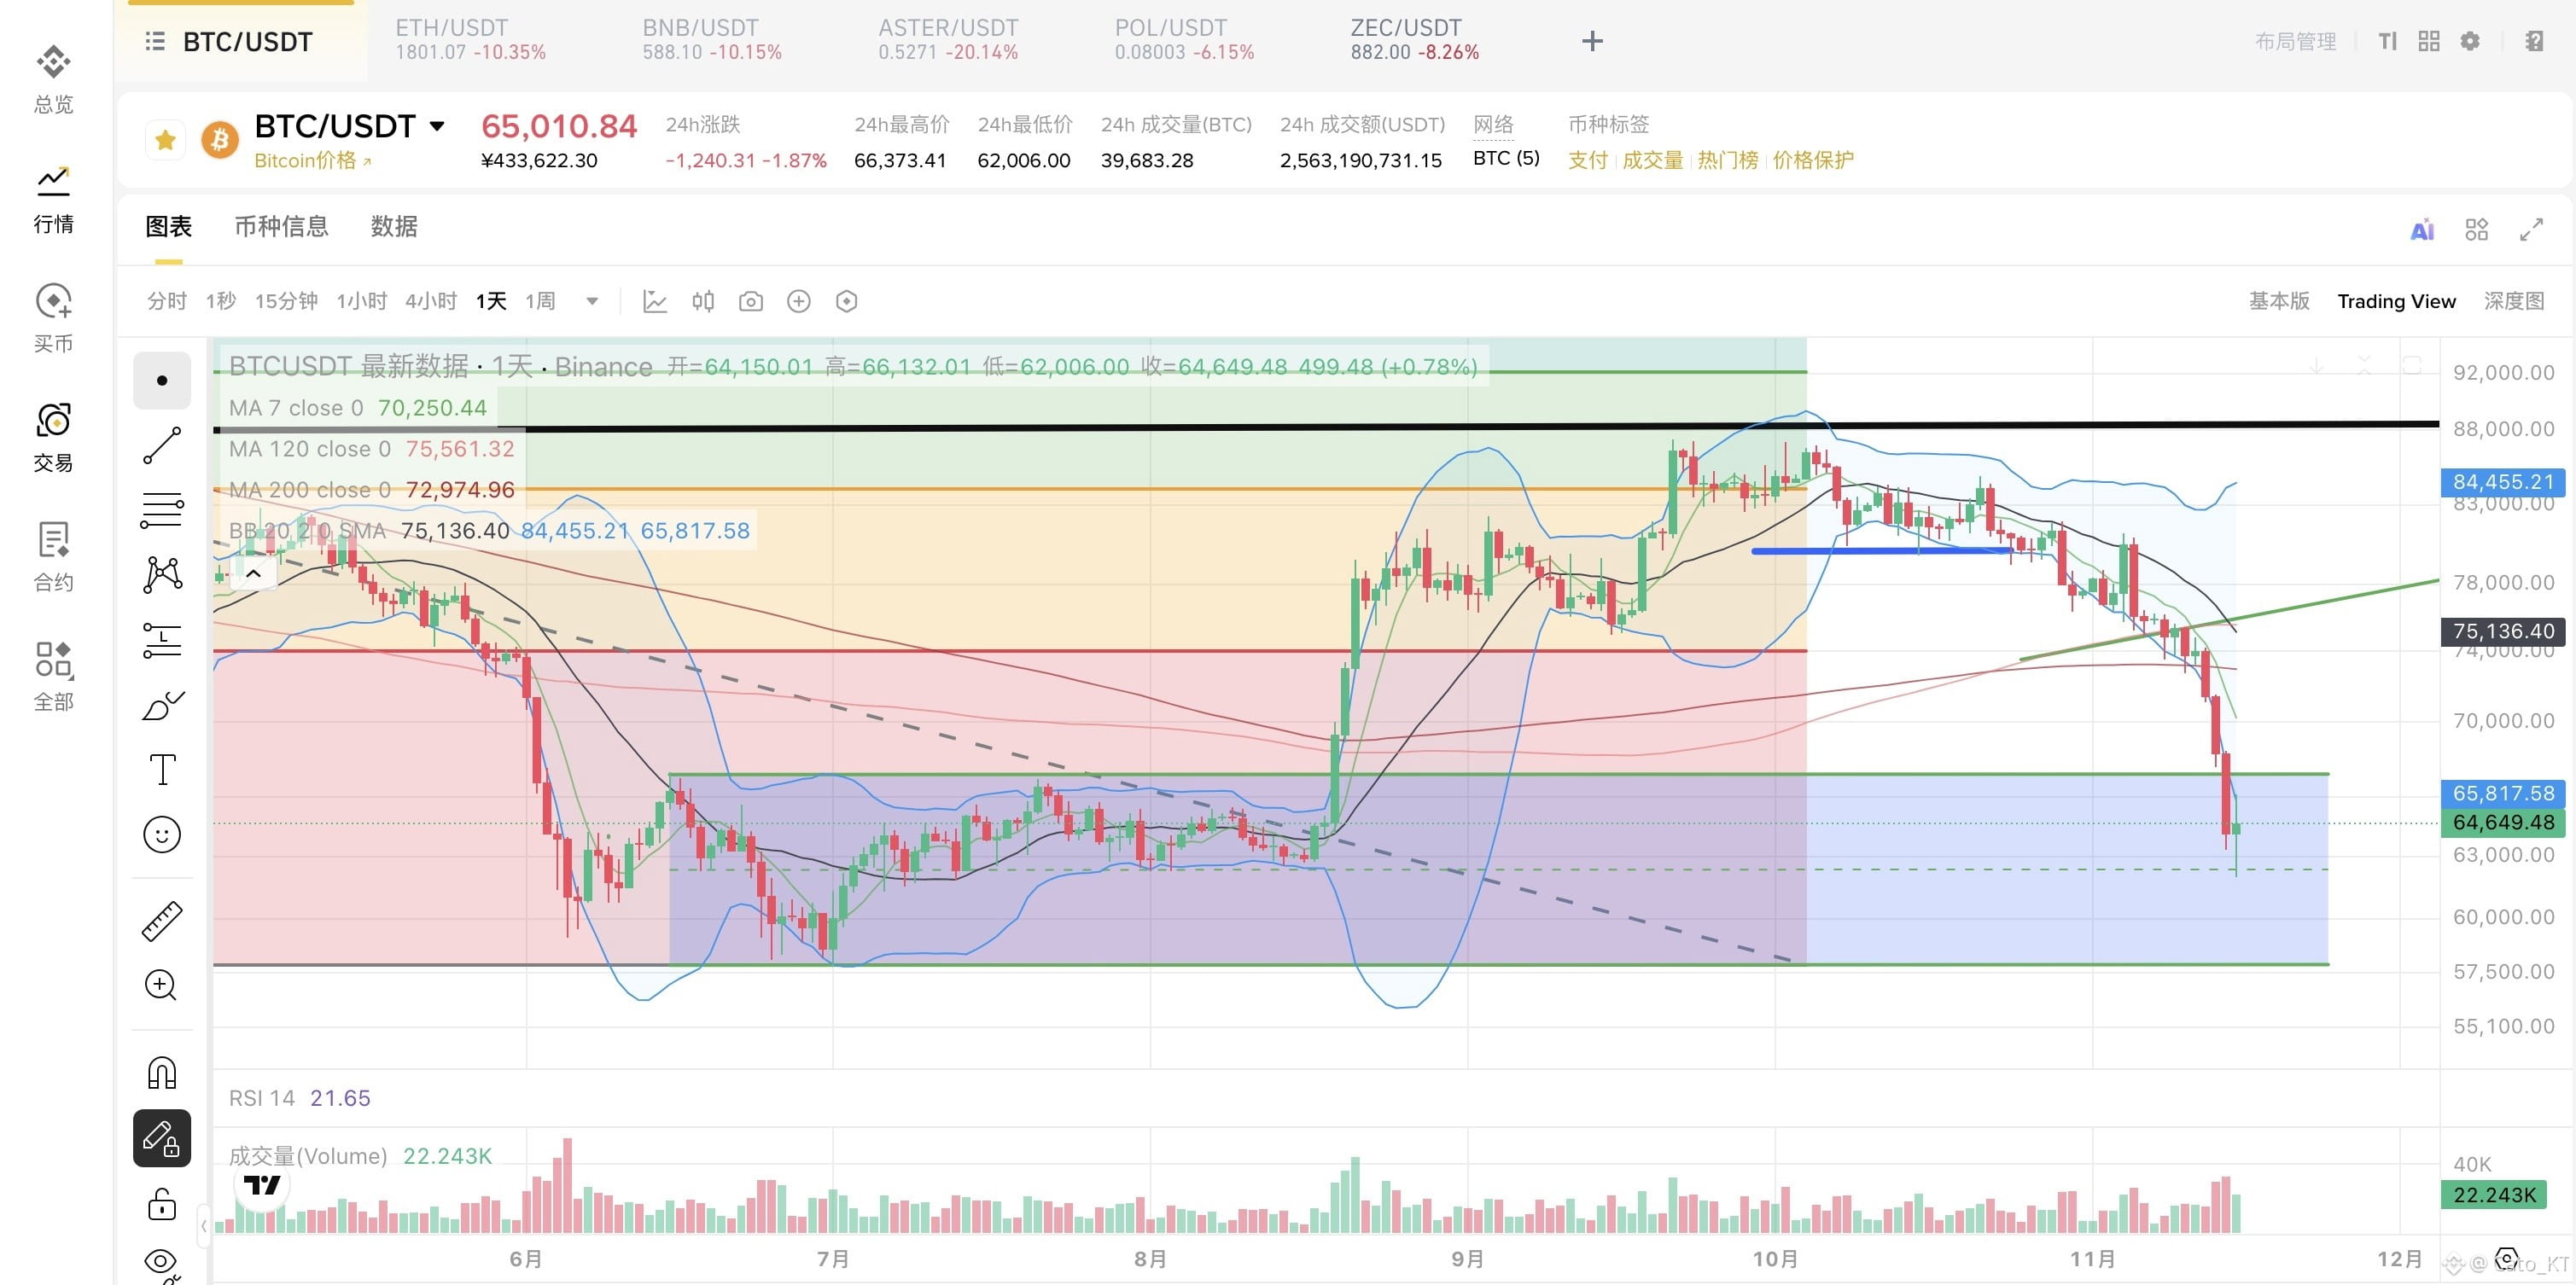
#Bitcoin price action: On Friday, I said that if the price fell to the 67,500 area—the top of the June–August bottoming range—and then broke below it decisively over the weekend, the next level to watch would be whether the 63,000–65,000 range could hold.
This range was where the market moved sideways near the bottom from June through August this year. A large volume of coins changed hands during that period, leaving the holder structure relatively stable. It is therefore a more suitable area of support from accumulated positions after the technical support at 73,000 was broken.
Today’s low was near 62,000, essentially completing a test of the accumulated-position support in the 63,000–65,000 range. The price is now rebounding.
Now let’s look at the rebound:
The rebound has been strong and effective on the hourly time frame. Both the 1-hour and 4-hour charts have seen strong rebounds, with the next three candles quickly recovering the highs from before the decline. This can be considered an effective rebound, or a valid sign that the decline has stopped.
The 1-hour to 4-hour charts have provisionally confirmed a pause in the decline. Next, we need to see whether a daily-chart signal confirms it. In practical terms, that means watching from Monday through Wednesday next week to see whether the price can get above 68,000. If it closes above 68,000 before Wednesday, that would confirm a daily-level pause in the decline and an effective rebound.
Then we need to assess the strength of the rebound. The key next week is whether the daily candle can close back above the daily MA200 (73,000). If it holds above that level, the rebound is stronger and the signal of a new trend starting is clear.
However, given the current macro environment and risk-market sentiment, the rebound is unlikely to be very strong. So, if the daily price closes above 68,000 by Wednesday next week, we can expect sideways trading in the 63,000–73,000 range.
Of course, this sideways-trading outlook assumes the daily price first closes back above 68,000 and then pulls back—a normal correction after the decline has paused.
If the daily chart cannot reclaim 68,000 before Wednesday, that means the decline has not yet stopped on the daily time frame. In that case, we should continue to expect a pullback and watch to see whether a new low is made!
Stage summary:
The current price action is relatively clear. From a right-side perspective, watch next week to see whether the daily chart confirms that the decline has stopped. Once it does, we need to check whether funds are flowing back into ETFs and the crypto market. If both returning inflows and a market rebound confirm the move, that would mean the short-term decline has effectively stopped and a preliminary bottom is in place. After that, we can watch for sideways base-building! #加密市场大幅回调,多名巨鲸遭遇清算
This range was where the market moved sideways near the bottom from June through August this year. A large volume of coins changed hands during that period, leaving the holder structure relatively stable. It is therefore a more suitable area of support from accumulated positions after the technical support at 73,000 was broken.
Today’s low was near 62,000, essentially completing a test of the accumulated-position support in the 63,000–65,000 range. The price is now rebounding.
Now let’s look at the rebound:
The rebound has been strong and effective on the hourly time frame. Both the 1-hour and 4-hour charts have seen strong rebounds, with the next three candles quickly recovering the highs from before the decline. This can be considered an effective rebound, or a valid sign that the decline has stopped.
The 1-hour to 4-hour charts have provisionally confirmed a pause in the decline. Next, we need to see whether a daily-chart signal confirms it. In practical terms, that means watching from Monday through Wednesday next week to see whether the price can get above 68,000. If it closes above 68,000 before Wednesday, that would confirm a daily-level pause in the decline and an effective rebound.
Then we need to assess the strength of the rebound. The key next week is whether the daily candle can close back above the daily MA200 (73,000). If it holds above that level, the rebound is stronger and the signal of a new trend starting is clear.
However, given the current macro environment and risk-market sentiment, the rebound is unlikely to be very strong. So, if the daily price closes above 68,000 by Wednesday next week, we can expect sideways trading in the 63,000–73,000 range.
Of course, this sideways-trading outlook assumes the daily price first closes back above 68,000 and then pulls back—a normal correction after the decline has paused.
If the daily chart cannot reclaim 68,000 before Wednesday, that means the decline has not yet stopped on the daily time frame. In that case, we should continue to expect a pullback and watch to see whether a new low is made!
Stage summary:
The current price action is relatively clear. From a right-side perspective, watch next week to see whether the daily chart confirms that the decline has stopped. Once it does, we need to check whether funds are flowing back into ETFs and the crypto market. If both returning inflows and a market rebound confirm the move, that would mean the short-term decline has effectively stopped and a preliminary bottom is in place. After that, we can watch for sideways base-building! #加密市场大幅回调,多名巨鲸遭遇清算