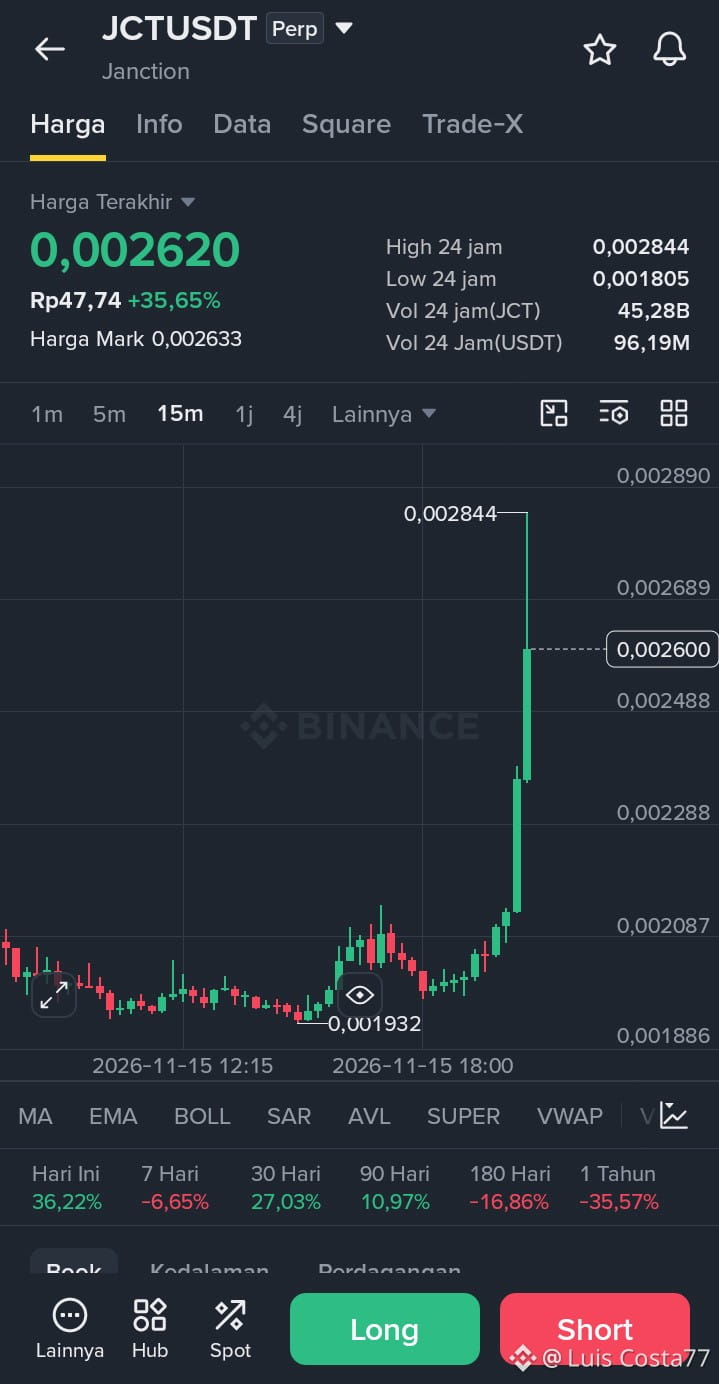
$JCT JCTUSDT - 15m - Long Sideways, Then Suddenly Explodes to the Top
1. Price Structure $JCT
Current price is 0.002620, up 35.65 percent. Daily high is 0.002844, daily low is 0.001805.
From the start of the chart through the middle, the price just moved sideways near the bottom, in the 0.0019 to 0.0020 area. Small ups and downs, with no direction.
Then it suddenly exploded with one huge vertical green candle to 0.002844. That was the daily peak. Now it’s dipping slightly to 0.002620, still holding near the top.
The rise was #JCTUSDT about 45 percent from the sideways area, in a very short time.
2. Volume and Momentum
Daily volume is 96.19M USDT, with JCT volume at 45.28B. That’s huge for a small coin like this.
This means the pump was backed by real money coming in all at once, not just a low-volume candle.
But because the rise was vertical, it’s vulnerable to profit-taking. Those who bought lower are already sitting on big gains; it’s just a matter of time before they sell.
3. Key Levels
- Resistance: 0.002844 - 0.002890. This is the daily peak; it needs to break through again for the price to continue higher.
- Support: 0.002600 - 0.002488. If 0.002600 breaks, the next level is 0.002488. If that breaks too, the price could return to the sideways area at 0.002087.
$JCT
1. Price Structure $JCT
Current price is 0.002620, up 35.65 percent. Daily high is 0.002844, daily low is 0.001805.
From the start of the chart through the middle, the price just moved sideways near the bottom, in the 0.0019 to 0.0020 area. Small ups and downs, with no direction.
Then it suddenly exploded with one huge vertical green candle to 0.002844. That was the daily peak. Now it’s dipping slightly to 0.002620, still holding near the top.
The rise was #JCTUSDT about 45 percent from the sideways area, in a very short time.
2. Volume and Momentum
Daily volume is 96.19M USDT, with JCT volume at 45.28B. That’s huge for a small coin like this.
This means the pump was backed by real money coming in all at once, not just a low-volume candle.
But because the rise was vertical, it’s vulnerable to profit-taking. Those who bought lower are already sitting on big gains; it’s just a matter of time before they sell.
3. Key Levels
- Resistance: 0.002844 - 0.002890. This is the daily peak; it needs to break through again for the price to continue higher.
- Support: 0.002600 - 0.002488. If 0.002600 breaks, the next level is 0.002488. If that breaks too, the price could return to the sideways area at 0.002087.
$JCT