$INIT / Initia - 4h Analysis
Looking at the 4h chart, what caught my attention about INIT was the way the move unfolded.
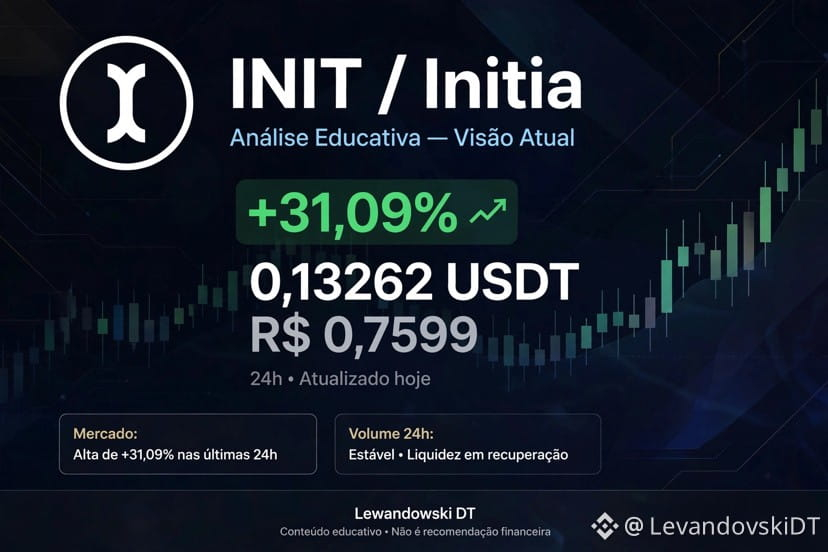
Current price at **0,13262 USDT / R$ 0,7599**, with a **+31,09%** change over 24h.
24h high at **0,14770** and 24h low at **0,09409**.
What the chart is showing:
After a long period of decline, with the price falling below the moving averages and making new lows, INIT bottomed around **0,09409** and bounced strongly. It was a reaction with green candles gaining momentum, breaking above the short-term moving averages and moving back above them.
This matters because it wasn’t just a brief rally. It was a defended bottom + a short-term structural recovery. When the price holds above a base that has been tested several times, the structure has more room to continue developing.
On the indicator, the RSI is at **64,31 / 53,18 / 49,12** — in other words, the short term is already heating up, but it hasn’t reached the excess of an overextended top. This calls for attention to follow-through, not euphoria.
Levels I’m watching on the chart:
**Support: 0,12400 - 0,09409**
**Resistance: 0,14770 - 0,16408**
If the price holds above **0,12400**, the recovery structure remains valid. If it loses this area, it could retest the bottom at **0,09409**.
Now I’d like to hear your take:
In your analysis, will INIT hold above 0,12400 or retest the bottom first?
Comment below with **1** if you’re watching for it to hold, or **2** if you’re watching for it to return to the bottom.
Save this post to follow its progress, and follow me for more analyses like this.
**Lewandowski DT**
**This is my own analysis, based on technical chart analysis, for educational purposes. It is not financial advice or a recommendation to buy or sell.**
#INIT #Initia #analisetecnica #Criptomoedas #daytrade
Looking at the 4h chart, what caught my attention about INIT was the way the move unfolded.
Current price at **0,13262 USDT / R$ 0,7599**, with a **+31,09%** change over 24h.
24h high at **0,14770** and 24h low at **0,09409**.
What the chart is showing:
After a long period of decline, with the price falling below the moving averages and making new lows, INIT bottomed around **0,09409** and bounced strongly. It was a reaction with green candles gaining momentum, breaking above the short-term moving averages and moving back above them.
This matters because it wasn’t just a brief rally. It was a defended bottom + a short-term structural recovery. When the price holds above a base that has been tested several times, the structure has more room to continue developing.
On the indicator, the RSI is at **64,31 / 53,18 / 49,12** — in other words, the short term is already heating up, but it hasn’t reached the excess of an overextended top. This calls for attention to follow-through, not euphoria.
Levels I’m watching on the chart:
**Support: 0,12400 - 0,09409**
**Resistance: 0,14770 - 0,16408**
If the price holds above **0,12400**, the recovery structure remains valid. If it loses this area, it could retest the bottom at **0,09409**.
Now I’d like to hear your take:
In your analysis, will INIT hold above 0,12400 or retest the bottom first?
Comment below with **1** if you’re watching for it to hold, or **2** if you’re watching for it to return to the bottom.
Save this post to follow its progress, and follow me for more analyses like this.
**Lewandowski DT**
**This is my own analysis, based on technical chart analysis, for educational purposes. It is not financial advice or a recommendation to buy or sell.**
#INIT #Initia #analisetecnica #Criptomoedas #daytrade