I’m pulling together the calls I made on Square this week to see how they held up.
On Thursday, I wrote, “After BTC has fallen 10% or more in 30 days, it has been up 7 days later in only 10 of 24 historical instances.” I got the direction right, but the median I cited was -1.1%. From that day’s close of 74,015 to now, it’s actually down 11.6%, to 65,456. I used a relatively mild historical figure to assess a market that fell more than 3% a day for three straight days. I understated it.
On Friday, I pointed out that BTC was hovering around its 200-week moving average, and that it had closed below it in only 48 of 483 weeks. Today’s intraday low of 62,006 is already around 8% below the average. This “rare” event arrived sooner than I expected.
On Saturday, I said the long-to-short ratio of 2.97 showed that the real anomaly wasn’t ETF outflows, but crowded longs. I think I got that right: the $1.9 billion in liquidations over the weekend was that crowded positioning being cleared out.
One call I got wrong: ahead of Tuesday’s CPI report, I wrote, “The thing I least want to bet on is direction: will 73,500 hold?” It didn’t. I treated it as a key level but didn’t say what I’d do if it broke. Going forward, I’ll include a plan for what happens if key levels break.
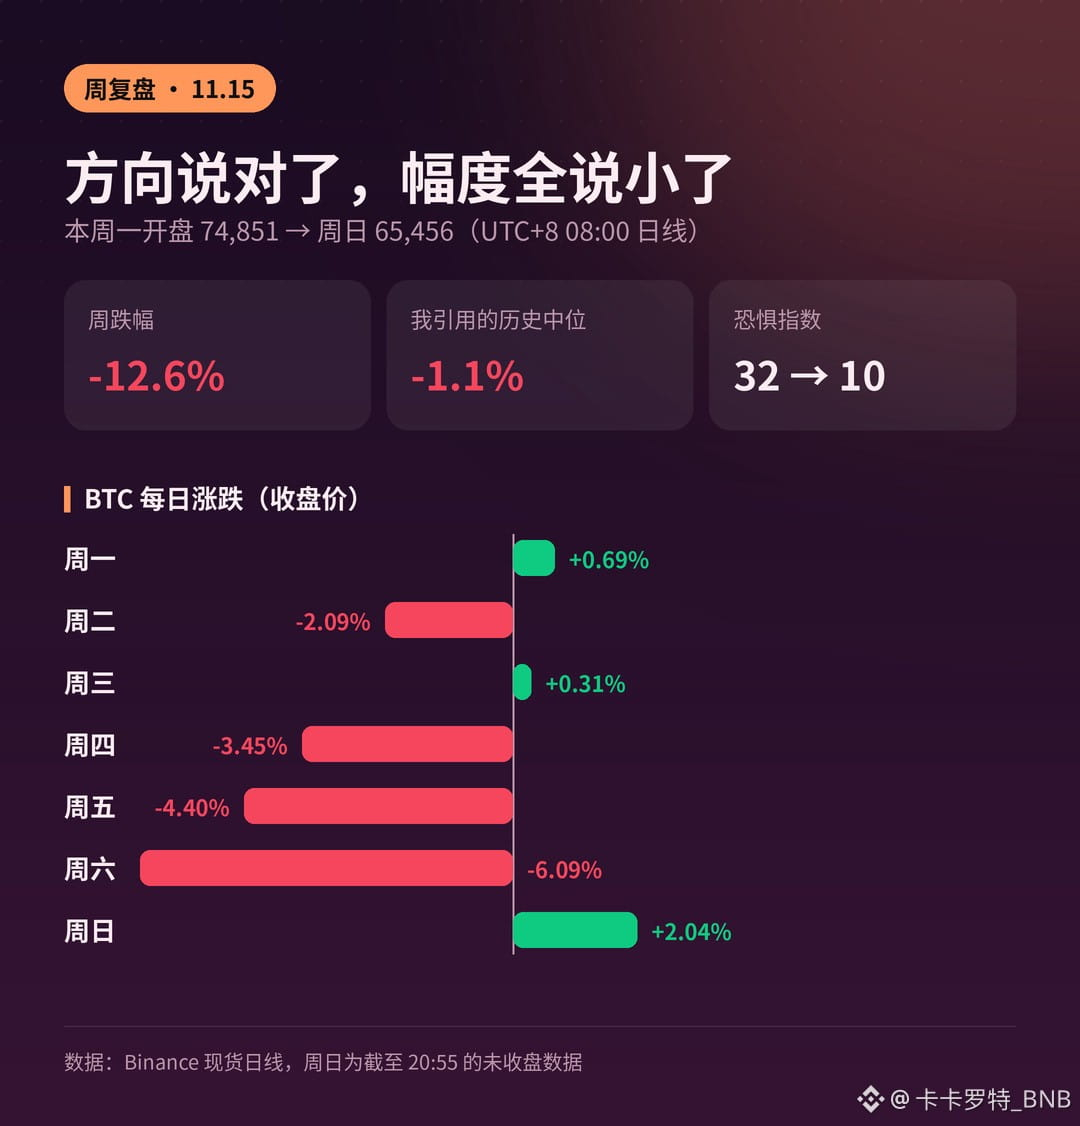
The market opened at 74,851 on Monday and is now at 65,456, down 12.6% for the week. The Fear Index fell from 32 to 10. My takeaway: historical stats can tell you which way the odds lean, but not how far the market will fall. Don’t use the median as a basis for setting your stop-loss.
There’s one thing I most want to test next week: when the Fear Index is below 10, does the market rebound over the following 7 days, or keep drifting lower? I’ll come back midweek with the data and see how it turned out.
Did you have a call this week where you got the direction right but your position size wrong? Tell me about it.
$BTC $ETH #Bitcoin
(For reference only; not investment advice)
On Thursday, I wrote, “After BTC has fallen 10% or more in 30 days, it has been up 7 days later in only 10 of 24 historical instances.” I got the direction right, but the median I cited was -1.1%. From that day’s close of 74,015 to now, it’s actually down 11.6%, to 65,456. I used a relatively mild historical figure to assess a market that fell more than 3% a day for three straight days. I understated it.
On Friday, I pointed out that BTC was hovering around its 200-week moving average, and that it had closed below it in only 48 of 483 weeks. Today’s intraday low of 62,006 is already around 8% below the average. This “rare” event arrived sooner than I expected.
On Saturday, I said the long-to-short ratio of 2.97 showed that the real anomaly wasn’t ETF outflows, but crowded longs. I think I got that right: the $1.9 billion in liquidations over the weekend was that crowded positioning being cleared out.
One call I got wrong: ahead of Tuesday’s CPI report, I wrote, “The thing I least want to bet on is direction: will 73,500 hold?” It didn’t. I treated it as a key level but didn’t say what I’d do if it broke. Going forward, I’ll include a plan for what happens if key levels break.
The market opened at 74,851 on Monday and is now at 65,456, down 12.6% for the week. The Fear Index fell from 32 to 10. My takeaway: historical stats can tell you which way the odds lean, but not how far the market will fall. Don’t use the median as a basis for setting your stop-loss.
There’s one thing I most want to test next week: when the Fear Index is below 10, does the market rebound over the following 7 days, or keep drifting lower? I’ll come back midweek with the data and see how it turned out.
Did you have a call this week where you got the direction right but your position size wrong? Tell me about it.
$BTC $ETH #Bitcoin
(For reference only; not investment advice)