
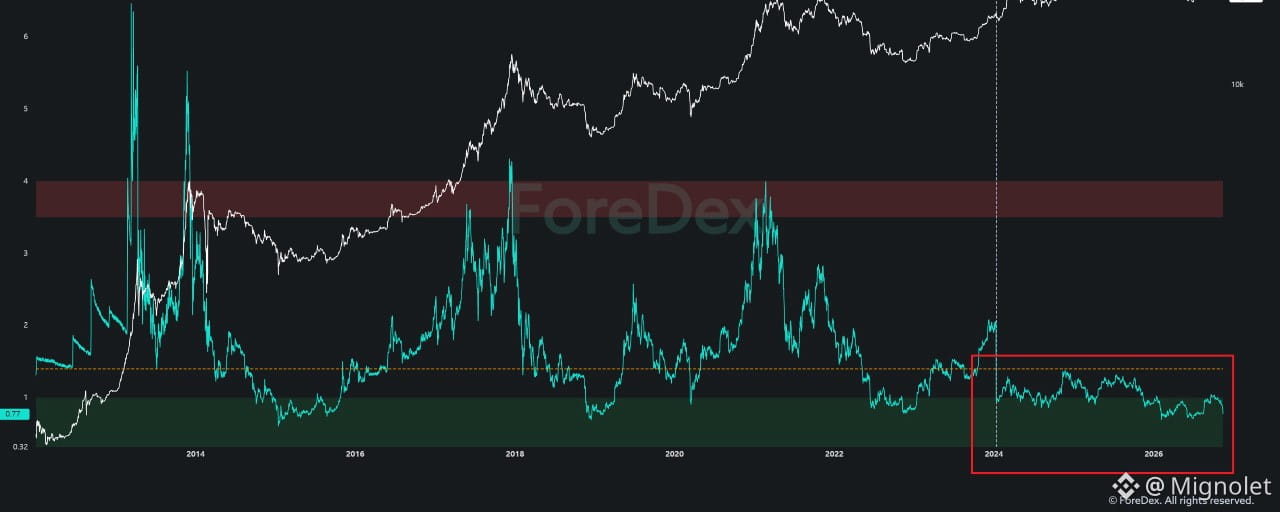


Why Am I Focusing on More Granular Liquidity Data Instead of Traditional On-Chain Indicators?
Those who have been following my analysis closely since last year will already know this.
I still actively use on-chain data. However, I rarely rely on indicators that broadly aggregate activity across the entire Bitcoin network anymore.
Instead, I break down market participants into more specific categories, quantify capital flows at the level of individual companies and institutions, and develop datasets that I can directly incorporate into my analysis.
ForeDex continues to develop new datasets based on this same analytical philosophy.
Some examples include:
OTC Data
Market Maker Data
Institutional Custody
DeFi Lending Liquidity
These datasets are designed to track specific market participants and activities directly involved in providing or utilizing liquidity.
In particular, DeFi Lending Liquidity allows us to analyze not only capital inflows but also the accumulation of leverage-driven liquidity and signs of overheating in market sentiment.
This dataset has been particularly helpful in navigating the current market, and I believe it could continue to play an important role in the future.
So why do I insist on breaking down on-chain data into such granular categories?
Because the Framework for Interpreting Traditional On-Chain Data Has Changed Since the Approval of Bitcoin ETFs.
Since the approval of spot Bitcoin ETFs, the market's trading structure and the way capital moves have changed significantly.
As a result, I believe traditional on-chain indicators now contain considerably more noise and structural distortion.
The problem is that many analysts continue applying historical interpretation frameworks without sufficiently accounting for these structural changes.
I am not suggesting that on-chain data has lost its value.
Quite the opposite. I firmly believe on-chain data remains extremely valuable.
However, when market structure changes, the framework we use to interpret the data must evolve as well.
Let me walk through a few examples.
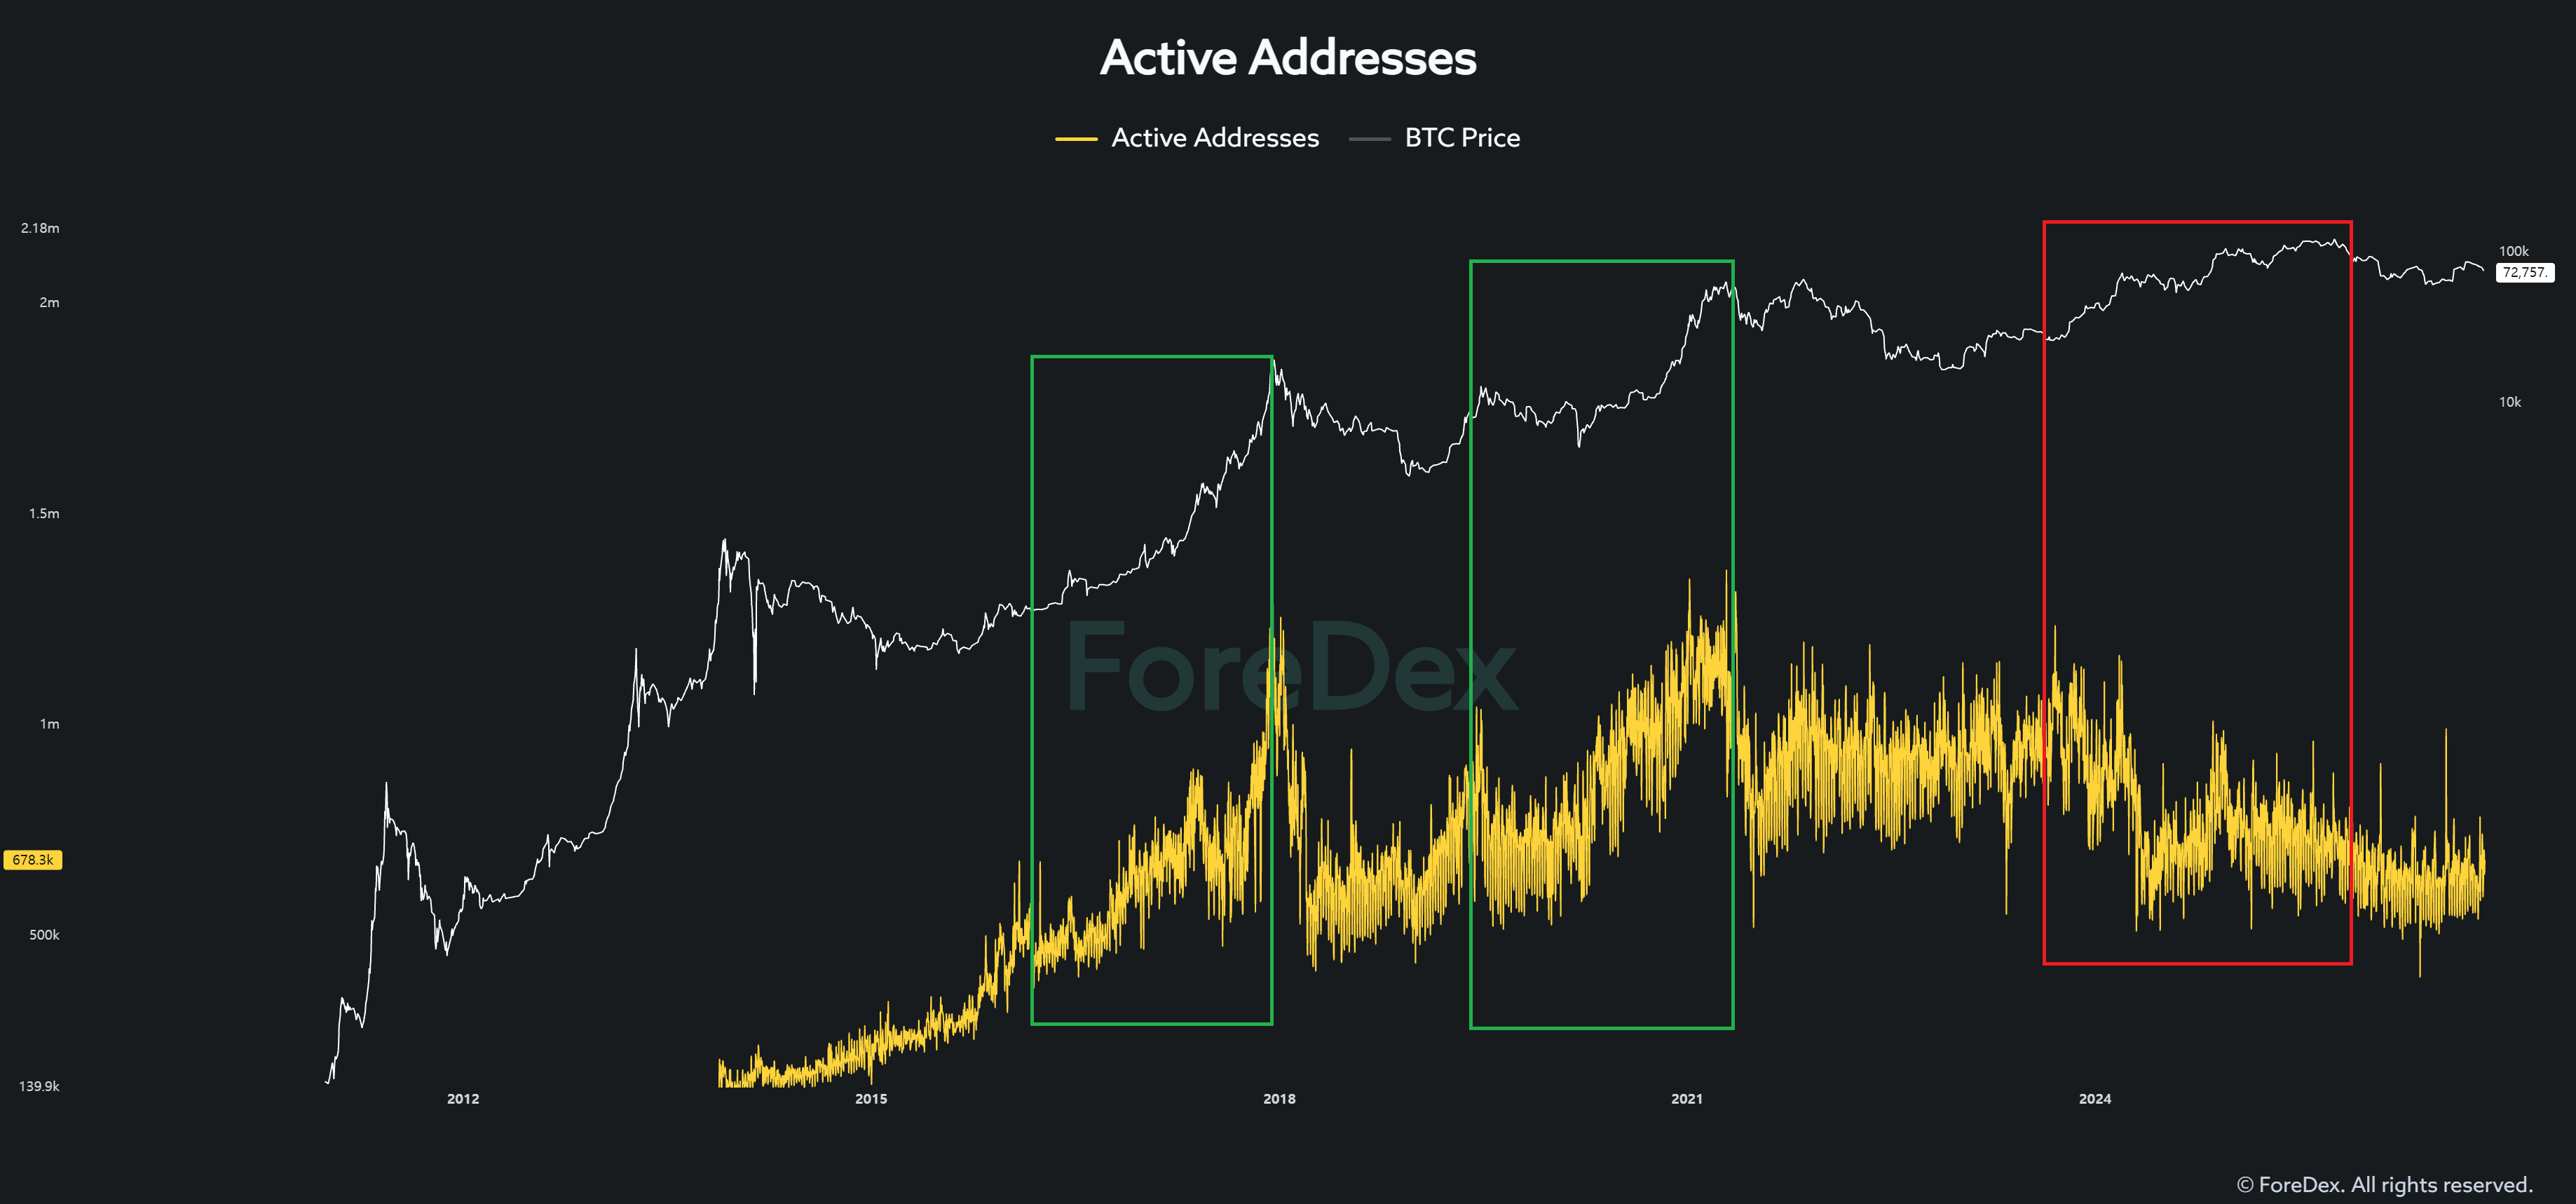
1. Active Addresses
During previous Bitcoin bull cycles, increases in active addresses generally moved in the same direction as Bitcoin's price.
However, that relationship has changed significantly during the current cycle.
Bitcoin's price has risen, but active addresses have failed to show the same level of growth seen in previous cycles.
Why is this happening?
I believe one of the major reasons is the structural change in trading activity following the approval of spot Bitcoin ETFs.
In the past, whales directly bought and transferred Bitcoin, generating on-chain transactions in the process.
Today, however, many institutions and investors gain Bitcoin exposure through ETFs, while ETF-related institutions handle the underlying Bitcoin custody, settlement, and related operations.
To illustrate this with an extreme example, trading activity that previously required 100 separate on-chain transactions might now be processed through a single transaction under a different market structure.
Of course, this is simply a hypothetical example intended to explain the structural change.
Now imagine this trading structure continuing for another three to five years.
Think seriously about how much it could change not only active addresses but also many other on-chain indicators.
2. Segmented MVRV Ratio
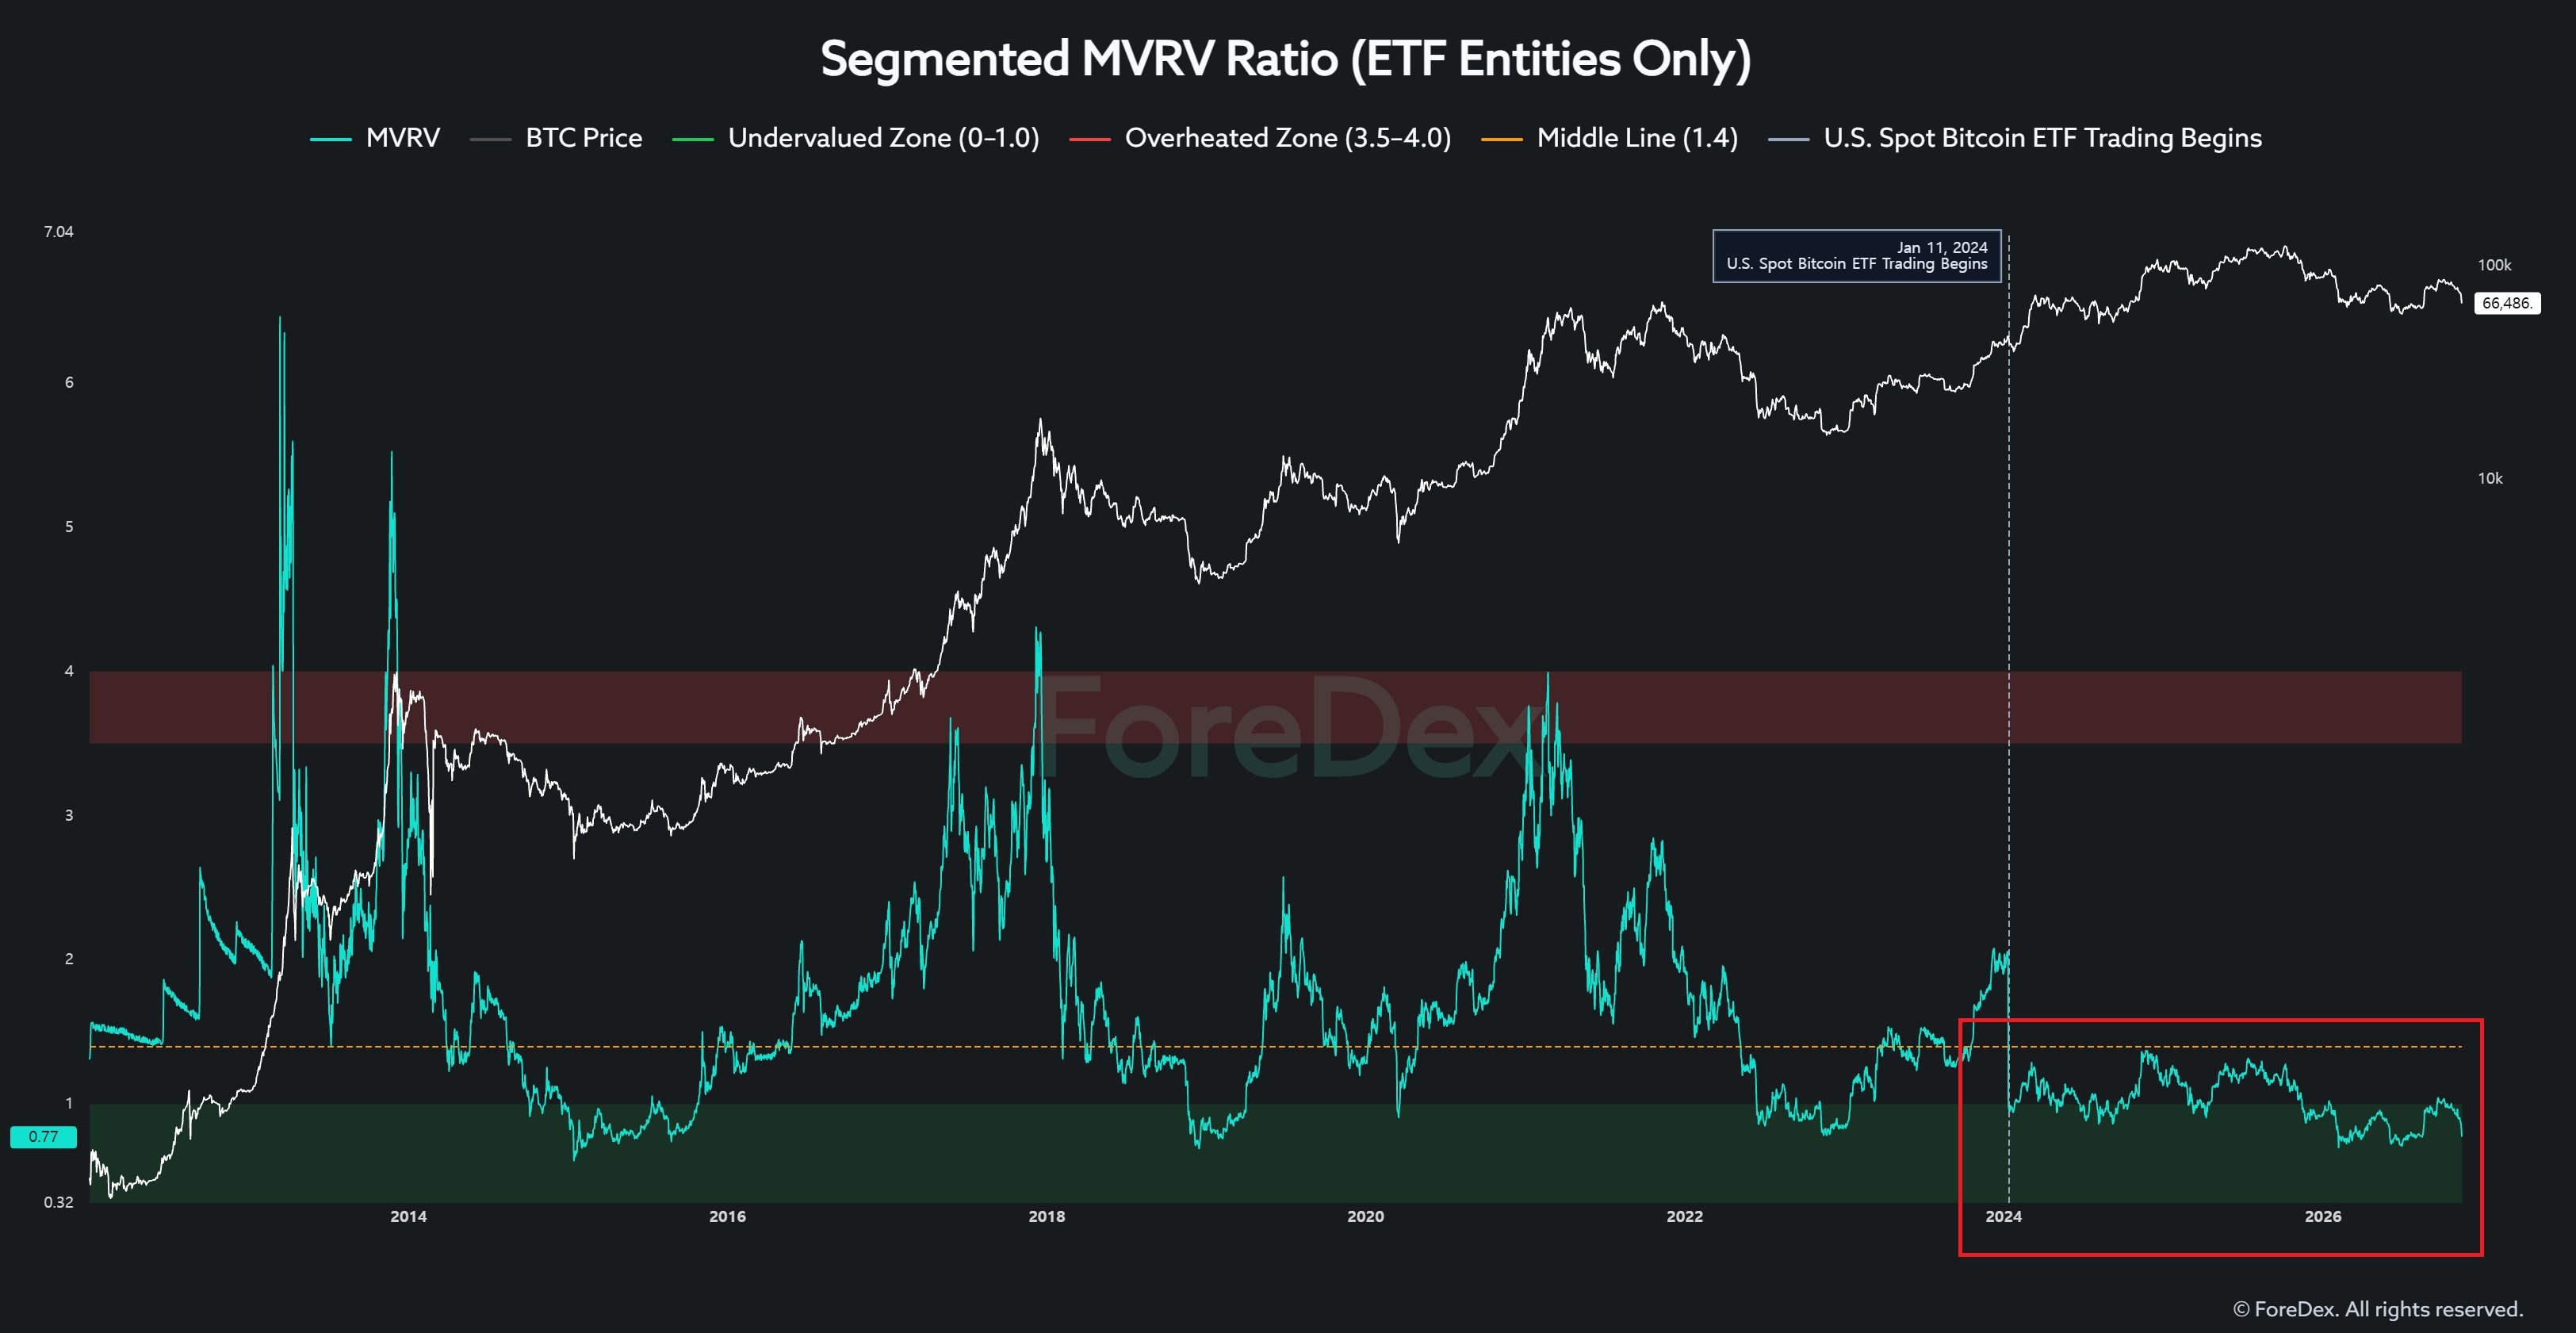
Now look at the Segmented MVRV Ratio, calculated specifically for ETF-related entities.
Its behavior is completely different from what we've historically observed in traditional MVRV indicators.
In particular, the ratio has struggled to rise significantly above the 1.0 level.
One possible explanation is that ETF-related entities operate under different custody and trading structures compared to traditional Bitcoin investors.
If ETFs continue to play a major role in the market, the MVRV of ETF-related entities may continue to behave within a different range from the historical MVRV of the broader Bitcoin market.
Now consider this:
If even MVRV, one of the most widely used on-chain indicators for years, is behaving differently from its historical patterns, can we really assume that other indicators remain unaffected?
3. Bitcoin Exchange Whale Inflow
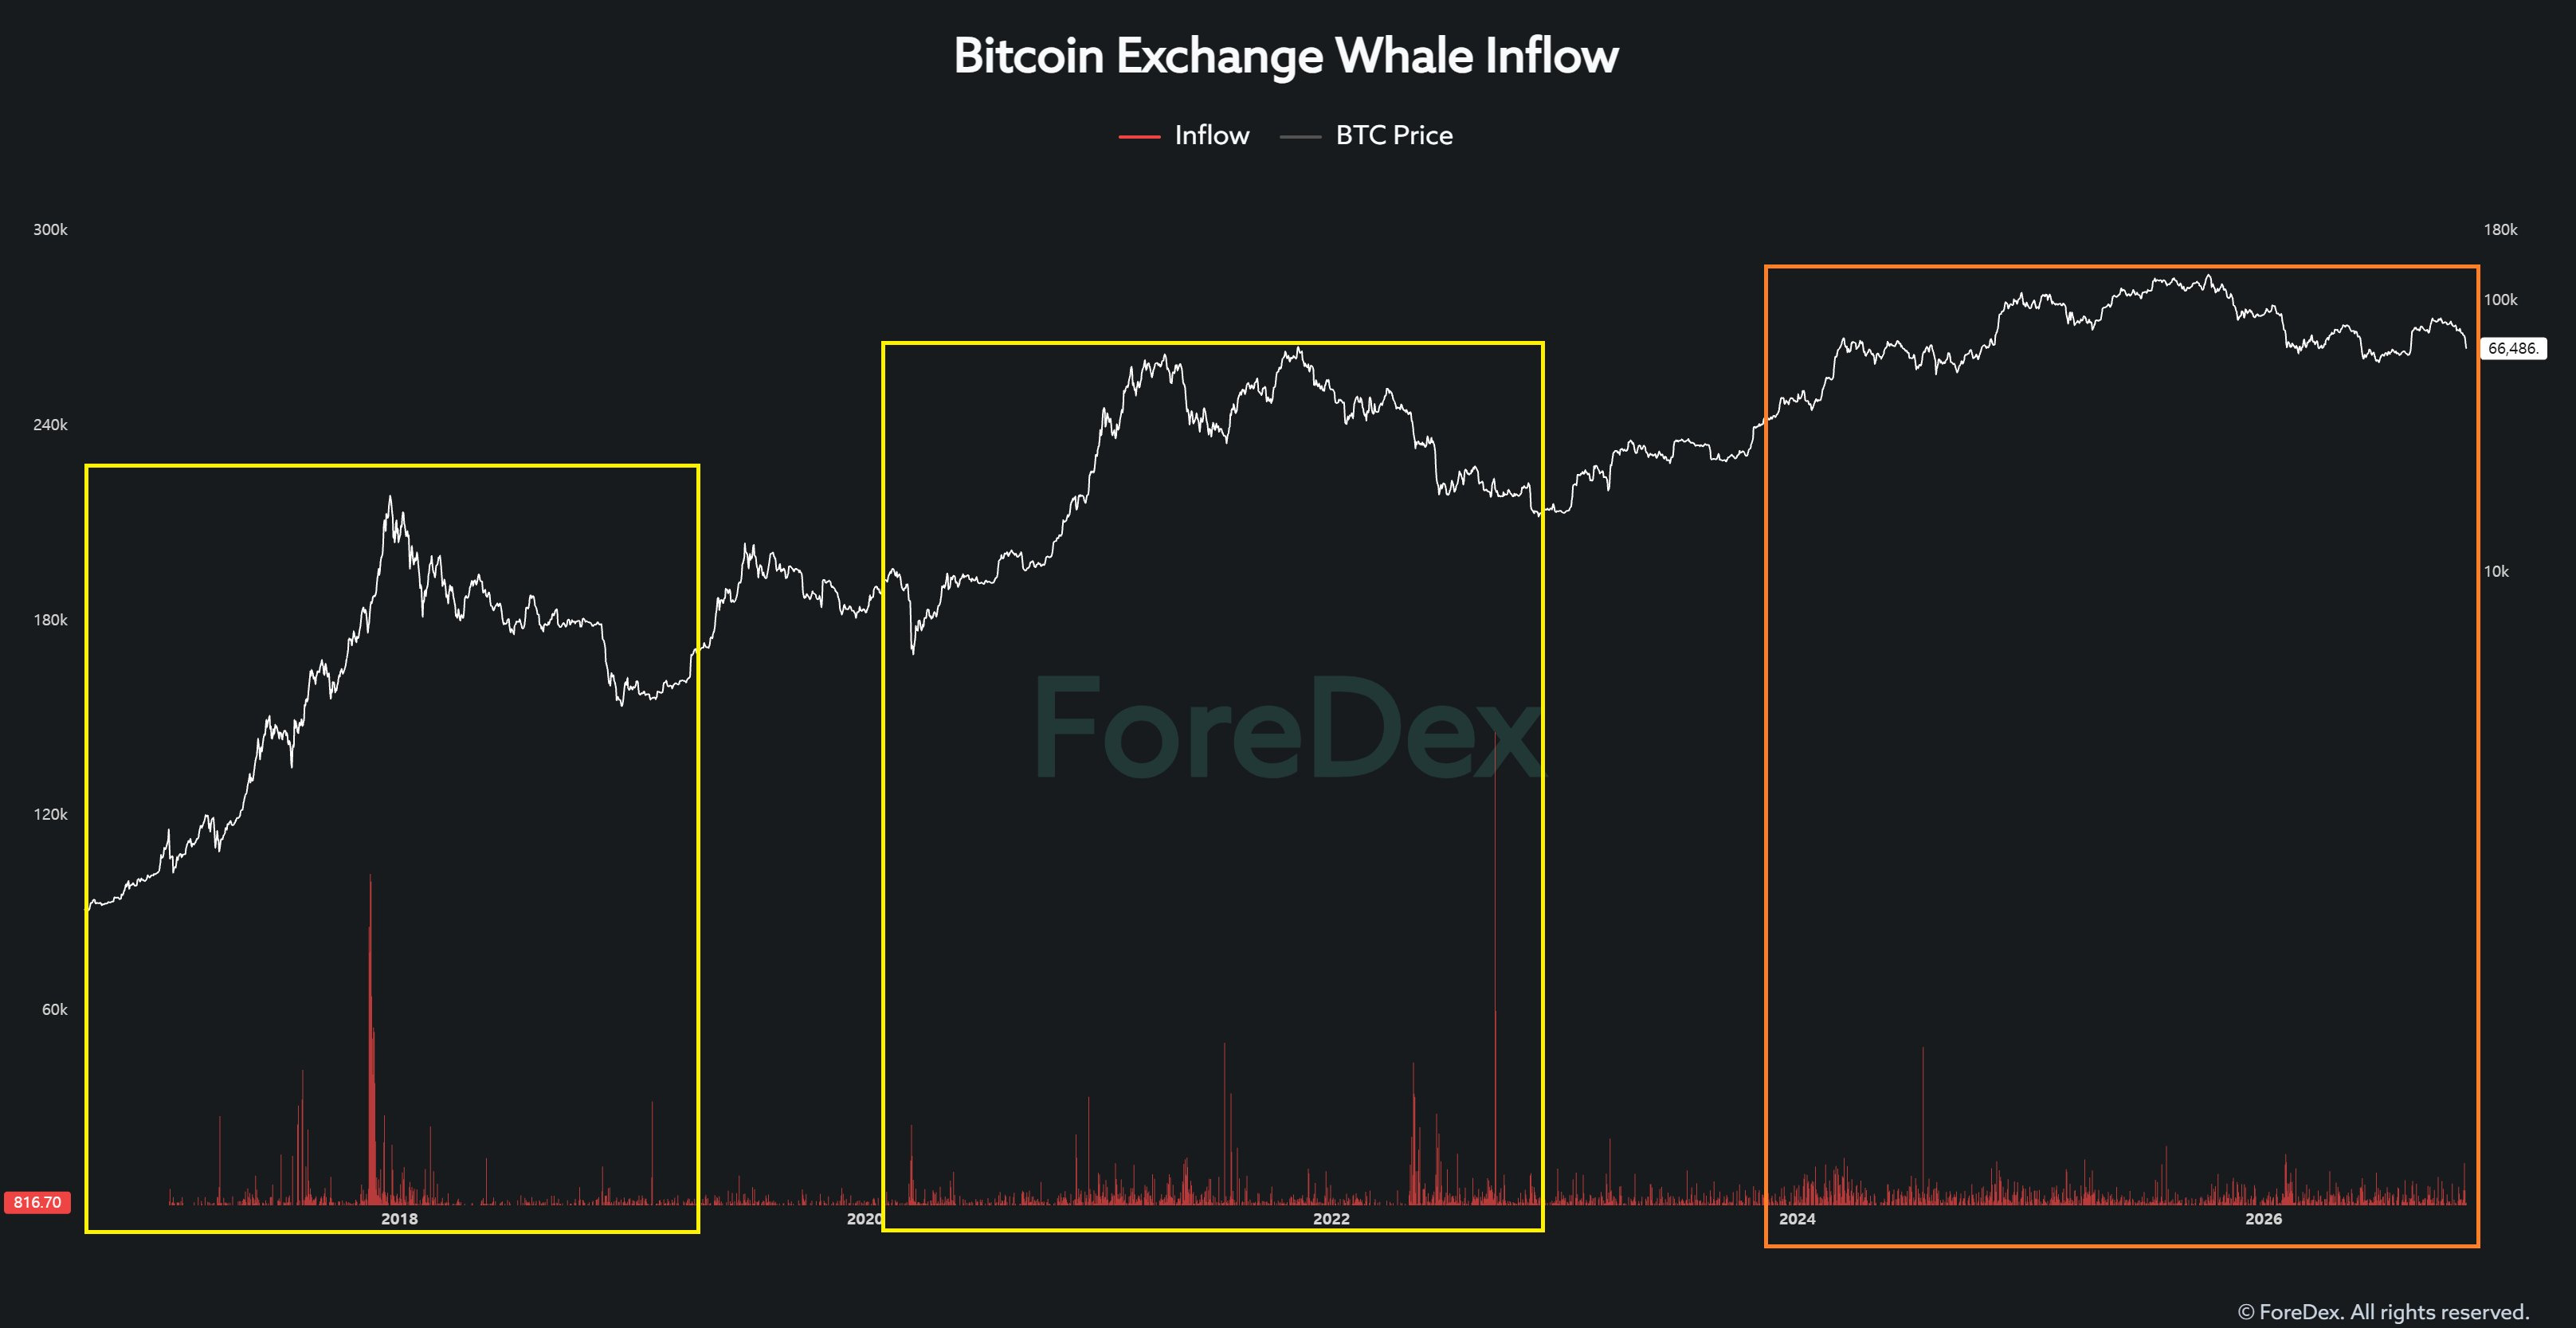
Next, let's examine exchange inflows specifically attributed to whale entities.
In previous cycles, severe market conditions sometimes produced whale inflows exceeding 10,000 BTC in a single day.
Large inflows of around 5,000 BTC were also frequently observed.
Today, however, even when similarly large transfers appear, many turn out to be internal wallet movements.
Does that mean whales have disappeared from the market?
No. It means the way whales conduct transactions has changed.
Compared to the past, whales increasingly utilize market makers and institutional trading infrastructure. They may also split large transfers into multiple smaller transactions.
For example, instead of depositing 3,000 BTC in a single transaction, a whale might now deposit 300 BTC across ten separate transactions.
Under these circumstances, traditional thresholds for identifying large whale deposits may fail to capture actual selling activity effectively.
The whales haven't necessarily disappeared. Rather, the traditional methods used to track them may no longer adequately reflect how the market operates.
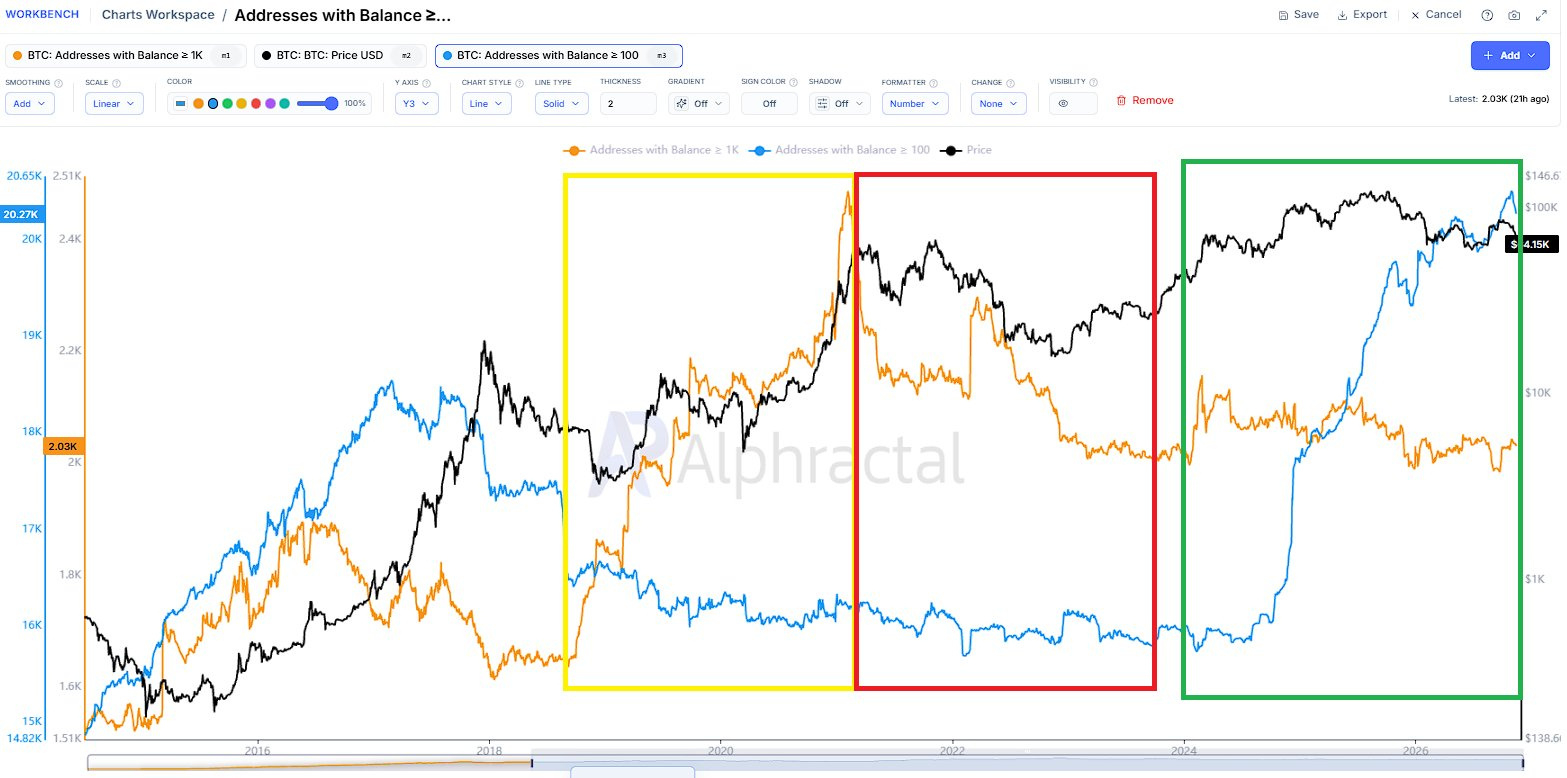
4. Addresses with Balance
Finally, let's examine Bitcoin addresses categorized by their holdings.
In the chart:
Orange line: Addresses holding at least 1,000 BTC
Blue line: Addresses holding at least 100 BTC
During the bull and bear market cycles between 2020 and 2023, accumulation and distribution among addresses holding at least 1,000 BTC were closely associated with major market movements.
However, the current cycle looks significantly different.
The number of addresses holding at least 1,000 BTC has remained relatively flat or even declined, while the number of addresses holding at least 100 BTC has increased sharply.
Why are we seeing such a divergence?
I believe changes in institutional Bitcoin custody and trading practices following ETF approval may have played an important role.
But here's the key point:
An increase in addresses holding at least 100 BTC does not automatically prove that genuine accumulation is taking place.
An increase in address count does not necessarily represent new investors entering the market or additional net buying.
Address counts can also change because of the redistribution of existing holdings, changes in custody structures, or internal wallet reorganizations.
So let me ask you something.
If genuine large-scale accumulation is taking place, how should we interpret a situation where addresses holding at least 1,000 BTC remain stagnant while addresses holding at least 100 BTC surge?
Simply pointing to the increase in 100 BTC addresses and declaring that accumulation is underway is not sufficient analysis.
It may amount to selectively choosing data that supports a conclusion you've already decided on.
Ultimately, What Matters Is Not Just the Data, but the Framework Used to Interpret It.
The message I want to convey through these four examples is straightforward.
The structure of the Bitcoin market has changed since ETF approval, and the framework for interpreting traditional, broadly aggregated on-chain indicators must change accordingly.
Indicators that were useful in previous cycles may now contain significantly more noise and structural distortion.
But how many people truly understand these changes well enough to establish new analytical standards?
And beyond the four examples I've discussed, can we really assume that other on-chain indicators are free from similar structural distortions?
During the 2025 bull market, did traditional on-chain indicators identify the market top as effectively as they had in previous cycles?
I believe this is a question worth considering seriously.
Again, I'm not saying traditional on-chain indicators have become completely useless.
However, if we continue applying historical interpretation frameworks without properly understanding the structural distortions embedded in the data, the accuracy of our investment decisions may actually deteriorate.
Until these distortions are better understood and more reliable interpretation frameworks emerge through subsequent market cycles, I don't intend to rely heavily on traditional, broadly aggregated on-chain indicators.
This is precisely why, since last year, I've shifted my focus away from simply aggregating market-wide data and toward identifying and analyzing the specific participants that actually drive liquidity flows.