🚨 $SOPH : SOMETHING IS CHANGING IN FUTURES POSITIONING… WATCH THESE 3 SIGNALS!
Not just the price I'm watching how traders are positioning and how aggressively buyers and sellers are fighting.
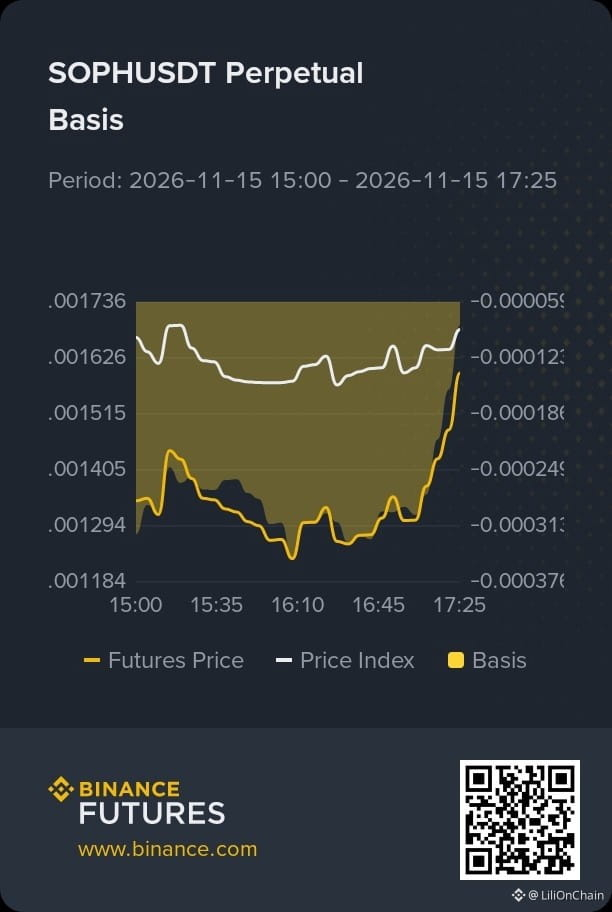
1️⃣ FUTURES BASIS: DISCOUNT IS NARROWING
Between 15:00 and 17:25, the futures price initially traded noticeably below the price index. But look at the final part of the chart: futures recovered sharply and the gap narrowed. This is worth watching because it suggests futures pricing is moving closer to the underlying index. However, the basis is not a standalone bullish signal. I want to see whether this convergence continues.
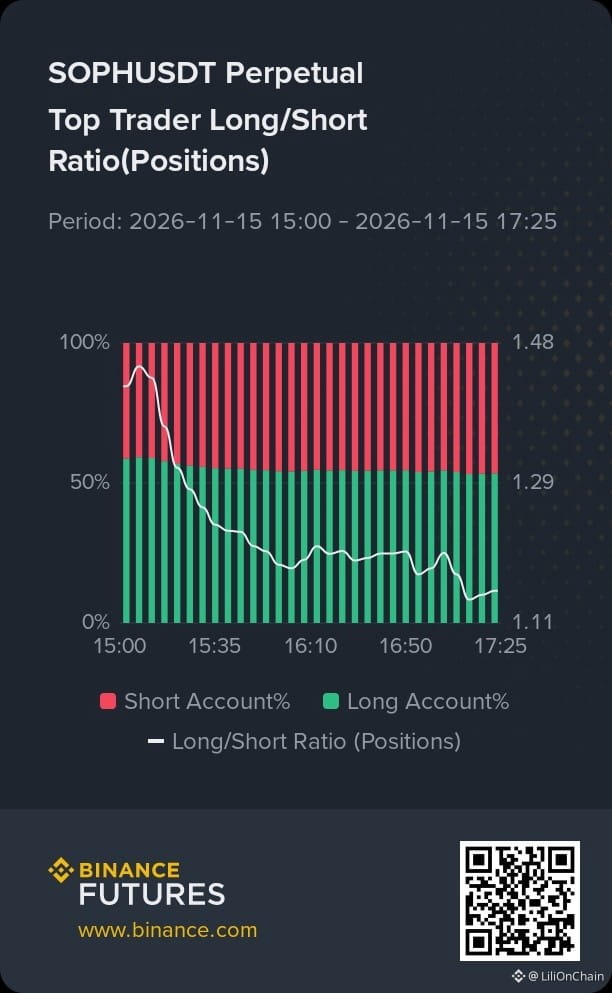
2️⃣ TOP TRADERS: LONG CONFIDENCE IS COOLING
This is probably the most interesting chart. The long/short ratio based on top traders' positions dropped from roughly 1.4 to around 1.11. That means the long bias weakened considerably during this period.
Long accounts still represented slightly more than short accounts, but the declining ratio tells me traders are becoming less aggressively positioned on the long side. I wouldn't ignore this signal.
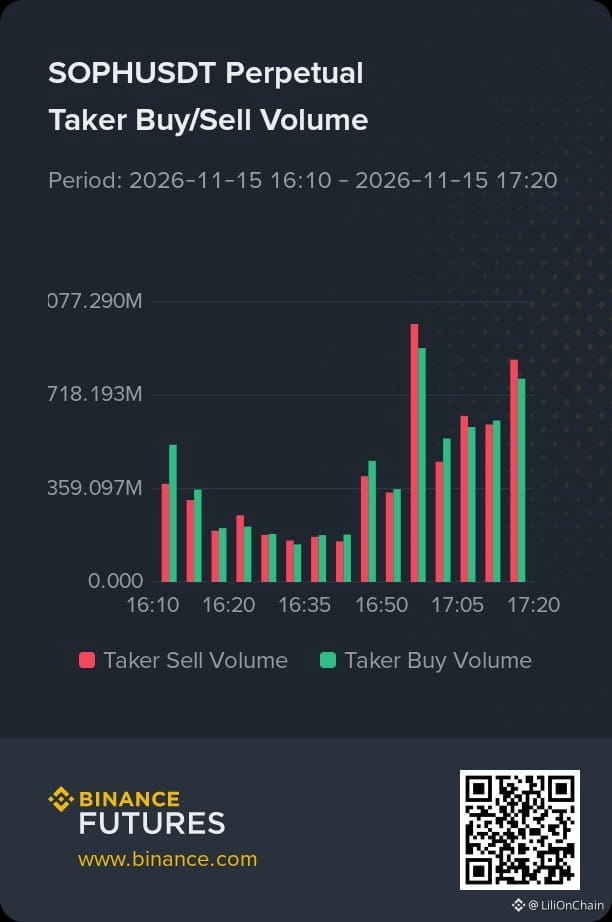
3️⃣ TAKER BUY/SELL VOLUME: BOTH SIDES ARE ACTIVE
The volume chart shows increased activity toward the end of the session. There are some strong buying bursts, but selling volume also remains aggressive. In several intervals, sellers are matching or exceeding buyers.
So, is this accumulation or distribution?
Too early to say. I want to see buyers consistently dominate, not just one or two green volume spikes.
I would rather wait for confirmation than enter just because #SOPH has started moving.
And the bigger question: Do you think SOPH is preparing for a recovery, or are traders still too cautious to trust this move?
$AKE #BinanceFutures $INIT #CryptoAnalysis #FuturesTrading #smartmoney
Not just the price I'm watching how traders are positioning and how aggressively buyers and sellers are fighting.
1️⃣ FUTURES BASIS: DISCOUNT IS NARROWING
Between 15:00 and 17:25, the futures price initially traded noticeably below the price index. But look at the final part of the chart: futures recovered sharply and the gap narrowed. This is worth watching because it suggests futures pricing is moving closer to the underlying index. However, the basis is not a standalone bullish signal. I want to see whether this convergence continues.
2️⃣ TOP TRADERS: LONG CONFIDENCE IS COOLING
This is probably the most interesting chart. The long/short ratio based on top traders' positions dropped from roughly 1.4 to around 1.11. That means the long bias weakened considerably during this period.
Long accounts still represented slightly more than short accounts, but the declining ratio tells me traders are becoming less aggressively positioned on the long side. I wouldn't ignore this signal.
3️⃣ TAKER BUY/SELL VOLUME: BOTH SIDES ARE ACTIVE
The volume chart shows increased activity toward the end of the session. There are some strong buying bursts, but selling volume also remains aggressive. In several intervals, sellers are matching or exceeding buyers.
So, is this accumulation or distribution?
Too early to say. I want to see buyers consistently dominate, not just one or two green volume spikes.
I would rather wait for confirmation than enter just because #SOPH has started moving.
And the bigger question: Do you think SOPH is preparing for a recovery, or are traders still too cautious to trust this move?
$AKE #BinanceFutures $INIT #CryptoAnalysis #FuturesTrading #smartmoney