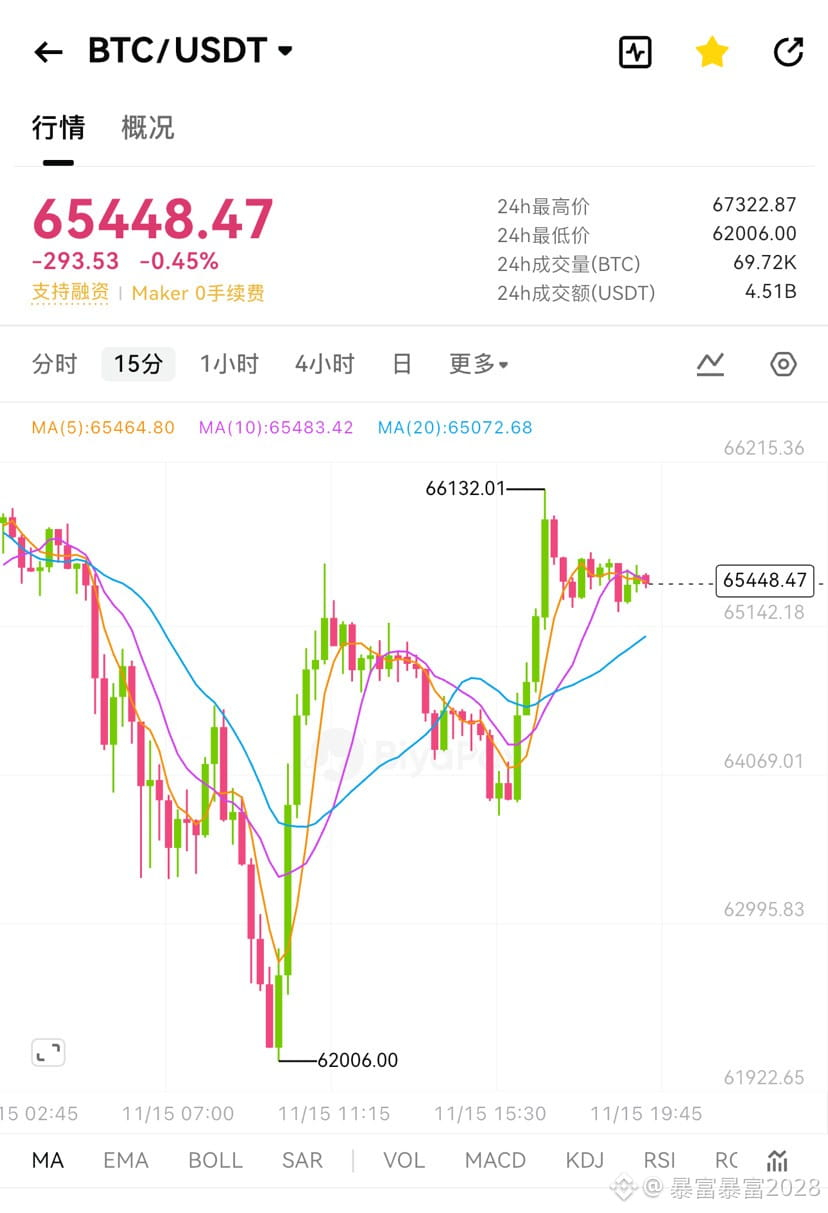
Bitcoin was hit by both technical and macro factors: Thin Asian weekend liquidity, BTC broke below the 200-day moving average at 73,000 and triggered a cascade of liquidations, hitting a low of 62,000 (its lowest since August), before bouncing to 64–65k during the European session. Since 10/21, it has fallen about 25%; the year-to-date low to watch is 57,742. Total liquidations across the crypto market reached 2.12 billion in the past 24 hours, including 684 million in BTC long positions; spot BTC ETFs saw nearly 3 billion in net outflows from 10/30 to 11/13.
Technical overview:
-Support: 62,000 (today's low area) / 58,000 (year-to-date previous low area) / 55,000
-Resistance: 68,500 (former support turned resistance) / 73,000 (200-day moving average) / 80,400
-Structure: GSR sees price “near the lower boundary of the long-term trend channel.” This is not a fundamental collapse, but deleveraging combined with institutional-scale selling pressure (Coinbase saw aggressive selling over the weekend).
-Capital flows: Rate-hike expectations (25 bp each in December/January/March) + retreat in AI stocks + Binance aftershocks; spot buying has yet to return.
Many people see just one BTC/USDT wick and panic-sell. For day-to-day market monitoring, you can check the latest crypto prices on BiyaPay, invest in global assets using USDT, and buy products such as U.S. and Hong Kong stocks and forex. Putting BTC, the Nasdaq, 10-year U.S. Treasuries, and the U.S. Dollar Index side by side helps you tell whether crypto is imploding on its own or global risk is being unwound.
Approach:
-Conservative: Look for a small position near the lower wick at 62–63k, stop-loss at 61.8k, targets 66–68.5k.
-Aggressive: Enter if 15-minute volume expands and price holds above 66k; target 68.5k. Exit on a false breakout.
-Risk: If a candle closes below 62k, watch 58k, then 55k.
-Avoid: Chasing at 65.5k or panic-selling at 62.2k.
BTC is near the lower boundary of its long-term channel, but preserve cash until deleveraging is complete. #BiyaPay #Sharp correction in the crypto market leaves multiple whales liquidated
Technical overview:
-Support: 62,000 (today's low area) / 58,000 (year-to-date previous low area) / 55,000
-Resistance: 68,500 (former support turned resistance) / 73,000 (200-day moving average) / 80,400
-Structure: GSR sees price “near the lower boundary of the long-term trend channel.” This is not a fundamental collapse, but deleveraging combined with institutional-scale selling pressure (Coinbase saw aggressive selling over the weekend).
-Capital flows: Rate-hike expectations (25 bp each in December/January/March) + retreat in AI stocks + Binance aftershocks; spot buying has yet to return.
Many people see just one BTC/USDT wick and panic-sell. For day-to-day market monitoring, you can check the latest crypto prices on BiyaPay, invest in global assets using USDT, and buy products such as U.S. and Hong Kong stocks and forex. Putting BTC, the Nasdaq, 10-year U.S. Treasuries, and the U.S. Dollar Index side by side helps you tell whether crypto is imploding on its own or global risk is being unwound.
Approach:
-Conservative: Look for a small position near the lower wick at 62–63k, stop-loss at 61.8k, targets 66–68.5k.
-Aggressive: Enter if 15-minute volume expands and price holds above 66k; target 68.5k. Exit on a false breakout.
-Risk: If a candle closes below 62k, watch 58k, then 55k.
-Avoid: Chasing at 65.5k or panic-selling at 62.2k.
BTC is near the lower boundary of its long-term channel, but preserve cash until deleveraging is complete. #BiyaPay #Sharp correction in the crypto market leaves multiple whales liquidated