
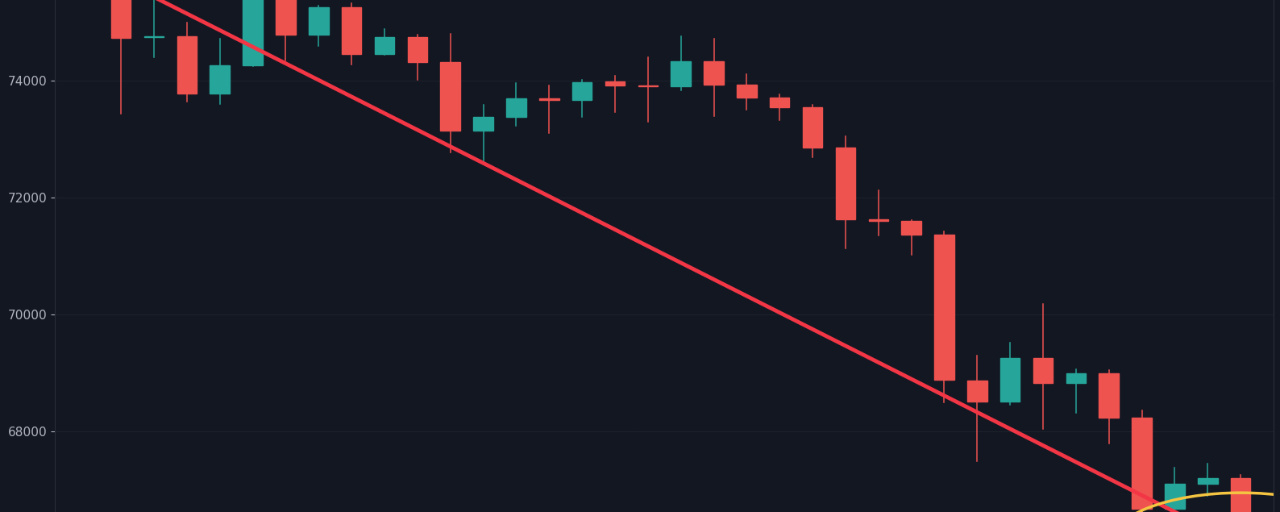

**A Red Chart Isn’t the End of the World**
You open the app first thing in the morning, see red all over the screen, and your heart starts racing. Take a breath. A red chart isn’t the end of the world—it’s just crypto being crypto.
It’s only natural for assets that can rise quickly to fall quickly too. That’s called volatility—in simple terms, how wildly prices move up and down over a short period. It’s an inherent feature of crypto, not a malfunction that should make you panic every time you see red.
**What to Check First When the Chart Is Red**
First, check how steep the drop is compared to usual. A five percent drop in crypto is like a light drizzle, not a storm. Even major coins can move that much in a day without any news. So don’t treat every red chart like a disaster.
Second, find out why. Is the whole global market down, is there major news, or is it just a normal correction after a big rally? A price drop caused by the overall market being weak is a different story from a coin falling on its own because its project is having problems.
Third, go back to your original plan. Why did you buy this coin, and how long did you plan to hold it? If your reason for buying still holds and you’re investing for the long term, today’s red screen is just noise. But if you bought it just because everyone else was, it’s understandable that you’re unsure what to do now.
Fourth, don’t make decisions when your emotions are running high. Panic selling means selling out of fear, not based on analysis. Many people don’t regret it when the price drops—they regret it when they see the price bounce back after they sold at the bottom. It hurts twice as much, and so does your wallet.
Fifth, use a red day to reassess, not to panic. Check your position size, your loss limit, and whether the money you’re using is truly money you can afford to set aside. If the fundamentals are solid, red is just weather. If the fundamentals are a mess, that’s what needs fixing, not the chart.
There’s one simple trick that often helps: zoom out. If you’re panicking over the past hour’s price action, try looking at the weekly or monthly chart. What looks like a cliff on the daily chart is often just a small wave in the bigger picture. Experienced traders always start with the big picture before reacting to small moves. Not because they’re braver, but because they understand the context. A price dropping ten percent after a big rally is a very different story from a price dropping ten percent when it was already on its last legs.
The bottom line is, chart colors are information, not a verdict. What usually causes big losses isn’t the price drop itself, but a panicked reaction without a plan.
When the chart turns red, are you the type to sit tight, check the news first, or immediately want to sell?
This content is for educational purposes only, not investment advice. Always DYOR and make decisions with a clear head.
#Volatility #CryptoBeginners #LearnCrypto