
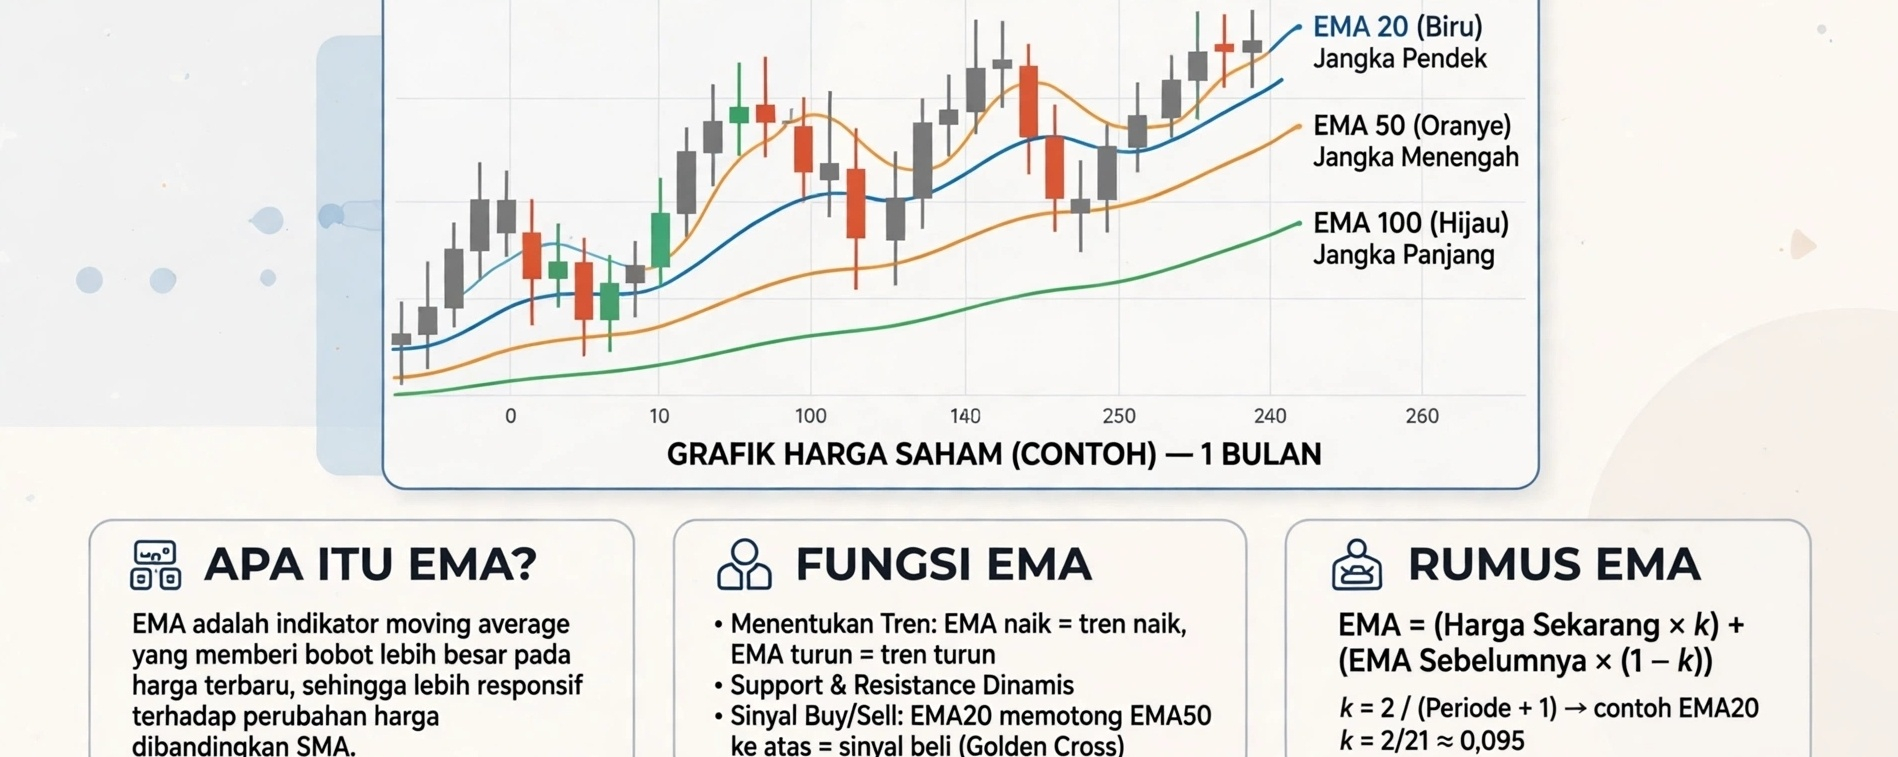

EMA stands for Exponential Moving Average. It represents the average price, but gives more weight to recent prices. That means it reacts faster than the SMA.
Simply put: The EMA is a line that follows the price, but more smoothly.
The Most Basic Way to Read It
- Price above the EMA: The trend is moving up, and buyers are stronger
- Price below the EMA: The trend is moving down, and sellers are stronger
- Price hovering around the EMA: The market is moving sideways, so don't force an entry
- EMA sloping upward: The uptrend is still strong
- EMA sloping downward: The downtrend is still strong
- Flat EMAs: No trend; the market is indecisive
The Most Commonly Used EMA Settings
EMA Purpose
EMA 9 / 20 To identify short-term trends; for scalping / day trading
EMA 50 To identify medium-term trends; a middle line often used as a reference
EMA 200 To identify the major trend; this is the sacred line. Above it = long-term bullish, below it = long-term bearish
You don’t need to use them all. Just start with these three: EMA 20, EMA 50, EMA 200
3 of the Most Commonly Profitable Ways to Use Them
1. Use as a Trend Filter
Don’t go against the trend.
- If the price is above EMA 200, look for BUY opportunities only, not SELL opportunities
- If the price is below EMA 200, look for SELL opportunities only, not BUY opportunities
This alone can save you from a lot of losses.
2. Use as Dynamic Support / Resistance
In an uptrend, the price often bounces off EMA 20 or EMA 50, then rises again. That’s called a _pullback_.
How to read it:
- The price rises, then gradually falls until it touches EMA 20 / 50
- Then another green candle appears—that’s a buy signal
- The opposite applies in a downtrend
3. Use Crossovers
This is the most well-known method.
- Golden Cross: The short EMA crosses the long EMA from below to above. For example, the EMA 20 crossing above the EMA 50 = a bullish signal
- Death Cross: The short EMA crosses the long EMA from above to below. For example, the EMA 20 crossing below the EMA 50 = a bearish signal
But remember, crossovers lag. They only appear after a trend is underway. So don’t use them on their own—use them only for confirmation.
Quick Chart-Reading Examples
For example, if you see this on a chart:
- EMA 20 is above EMA 50, EMA 50 is above EMA 200, all sloping upward, and the price is above all three = A perfect uptrend; look to buy on pullbacks
- EMA 20 is below EMA 50, EMA 50 is below EMA 200, all sloping downward, and the price is below all three = A perfect downtrend; look to sell on pullbacks
- The lines are tangled and keep crossing, while the price moves back and forth = Sideways market; better to sit it out
Common Mistakes Beginners Make
- Using EMAs on their own: An EMA only indicates direction; it’s not a buy/sell button. It should be combined with price action or candlestick patterns.
- Constantly changing settings: Using EMA 20 today, switching to 34 tomorrow, then to 21 the day after. You’ll only end up confusing yourself.
- Entering when an EMA has just crossed during a sideways market: In sideways markets, crossovers are often false, and you can keep getting caught by fakeouts.
Follow for daily signal analysis and educational content!!