
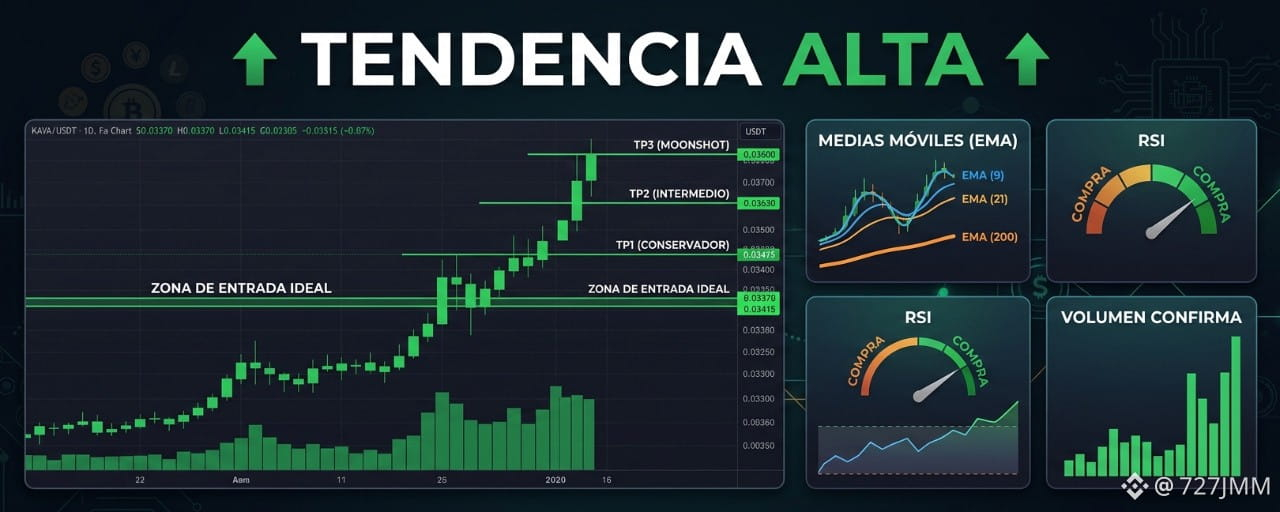


KAVA/USDT is trading around $0.03401. We are seeing a precisely aligned technical setup across the daily, 15m, and 5m charts.
Situation Analysis
Market Structure: We are in a strong accumulation phase following an institutional liquidity sweep at macro support. On the 15m/5m timeframes, price is forming higher lows.
Moving Averages (EMAs & MAs): The EMAs (9 and 21) show a bullish crossover (local Golden Cross) on the 15m timeframe, while the 200 EMA is acting as unbreakable dynamic support. The daily MAs (50 and 100) are consolidating a firm buying base.
Strength (RSI & Volume): The RSI rebounds strongly from neutral/oversold compression zones, and volume confirms institutional liquidity entering with each test of support.
Trade Setup
Ideal Entry Zone: $0.03370 – $0.03415
TP1 (Conservative): $0.03550 (Secure initial profits)
TP2 (Intermediate): $0.03720 (Technical resistance and key Fibonacci level)
TP3 (Moonshot): $0.03980+ (Extended projection driven by volume expansion)
Stop Loss (SL): $0.03260 (Strict technical invalidation below the latest structural support)
Trade Rationale
We are entering to capitalize on a technical rebound at the confluence of the 200 EMA and an RSI emerging from the bearish exhaustion zone on lower time frames, supported by a clean accumulation structure that anticipates an imminent bullish expansion.