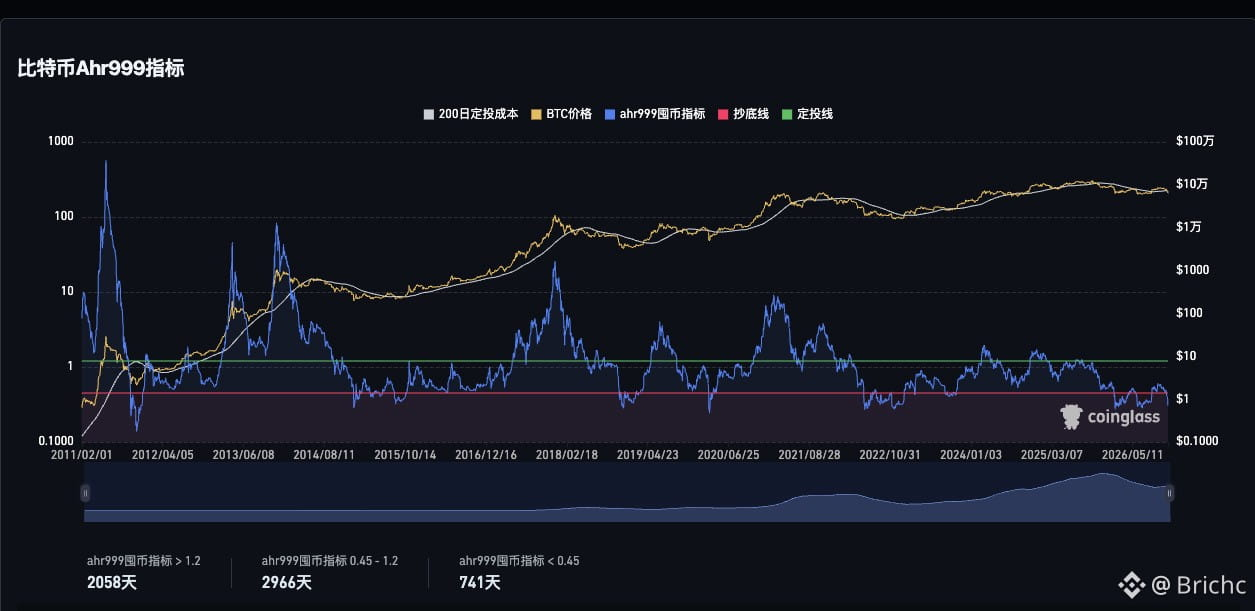
【Ahr999 has fallen to 0.3064 and is still dropping. Can you really buy the dip in what’s supposedly the dip-buying zone?】
Ahr999 has been in the dip-buying zone for 9 consecutive days, with its reading falling from 0.3477 to 0.3064. Yet $BTC kept sliding, falling to around $62,000. This doesn’t mean the indicator has failed; rather, many people mistake an “undervalued range” for a “price bottom.” Ahr999 takes into account both the 200-day dollar-cost averaging cost and a long-term growth valuation. It shows where the price stands relative to historical valuations, but it doesn’t predict when a decline will end.
BTC is currently around $64,000, already below the 200-day dollar-cost averaging cost of $72,500. Meanwhile, U.S. spot BTC ETFs have seen net outflows for 7 consecutive trading days, totaling about $1.91 billion, while liquidations across the market over the past 24 hours have approached $2 billion. Capital outflows and leveraged liquidations are ongoing, and low valuations don’t immediately translate into buying pressure.
I don’t think Ahr999 is useless. It’s suited to identifying long-term accumulation ranges, but not to pinpointing a market bottom. The historical record of spending 82 consecutive days in the dip-buying zone also shows that once the market enters undervalued territory, it can continue to grind along the bottom or even fall sharply. You could consider building a position in stages now, but don’t rush to use up all your ammunition just because the indicator has reached 0.3. The indicator tells you how cheap the price has become; to know when the market will stop falling, you still have to watch for real capital to return.
Ahr999 has been in the dip-buying zone for 9 consecutive days, with its reading falling from 0.3477 to 0.3064. Yet $BTC kept sliding, falling to around $62,000. This doesn’t mean the indicator has failed; rather, many people mistake an “undervalued range” for a “price bottom.” Ahr999 takes into account both the 200-day dollar-cost averaging cost and a long-term growth valuation. It shows where the price stands relative to historical valuations, but it doesn’t predict when a decline will end.
BTC is currently around $64,000, already below the 200-day dollar-cost averaging cost of $72,500. Meanwhile, U.S. spot BTC ETFs have seen net outflows for 7 consecutive trading days, totaling about $1.91 billion, while liquidations across the market over the past 24 hours have approached $2 billion. Capital outflows and leveraged liquidations are ongoing, and low valuations don’t immediately translate into buying pressure.
I don’t think Ahr999 is useless. It’s suited to identifying long-term accumulation ranges, but not to pinpointing a market bottom. The historical record of spending 82 consecutive days in the dip-buying zone also shows that once the market enters undervalued territory, it can continue to grind along the bottom or even fall sharply. You could consider building a position in stages now, but don’t rush to use up all your ammunition just because the indicator has reached 0.3. The indicator tells you how cheap the price has become; to know when the market will stop falling, you still have to watch for real capital to return.