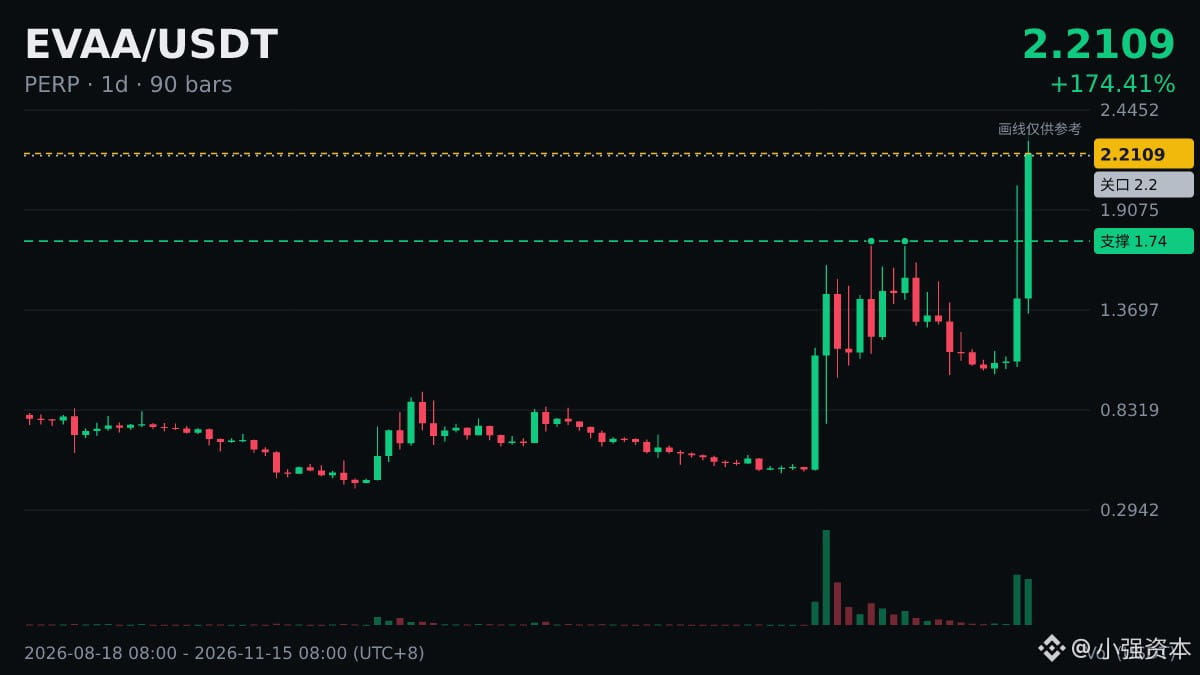
📌 Latest data: $EVAA |Daily RSI(14) 76.5|Overbought
· Definition: RSI’s 14 means 14 candlesticks: on a 4-hour chart, that spans a little over two days (56 hours); on a daily chart, it spans two weeks.
· How to read it: RSI is generally more effective in sideways markets, while in trending markets it often signals a reversal too early.
Before trading with leverage, first consider whether you can withstand the worst-case scenario, then look at what the signals say.
· Definition: RSI’s 14 means 14 candlesticks: on a 4-hour chart, that spans a little over two days (56 hours); on a daily chart, it spans two weeks.
· How to read it: RSI is generally more effective in sideways markets, while in trending markets it often signals a reversal too early.
Before trading with leverage, first consider whether you can withstand the worst-case scenario, then look at what the signals say.