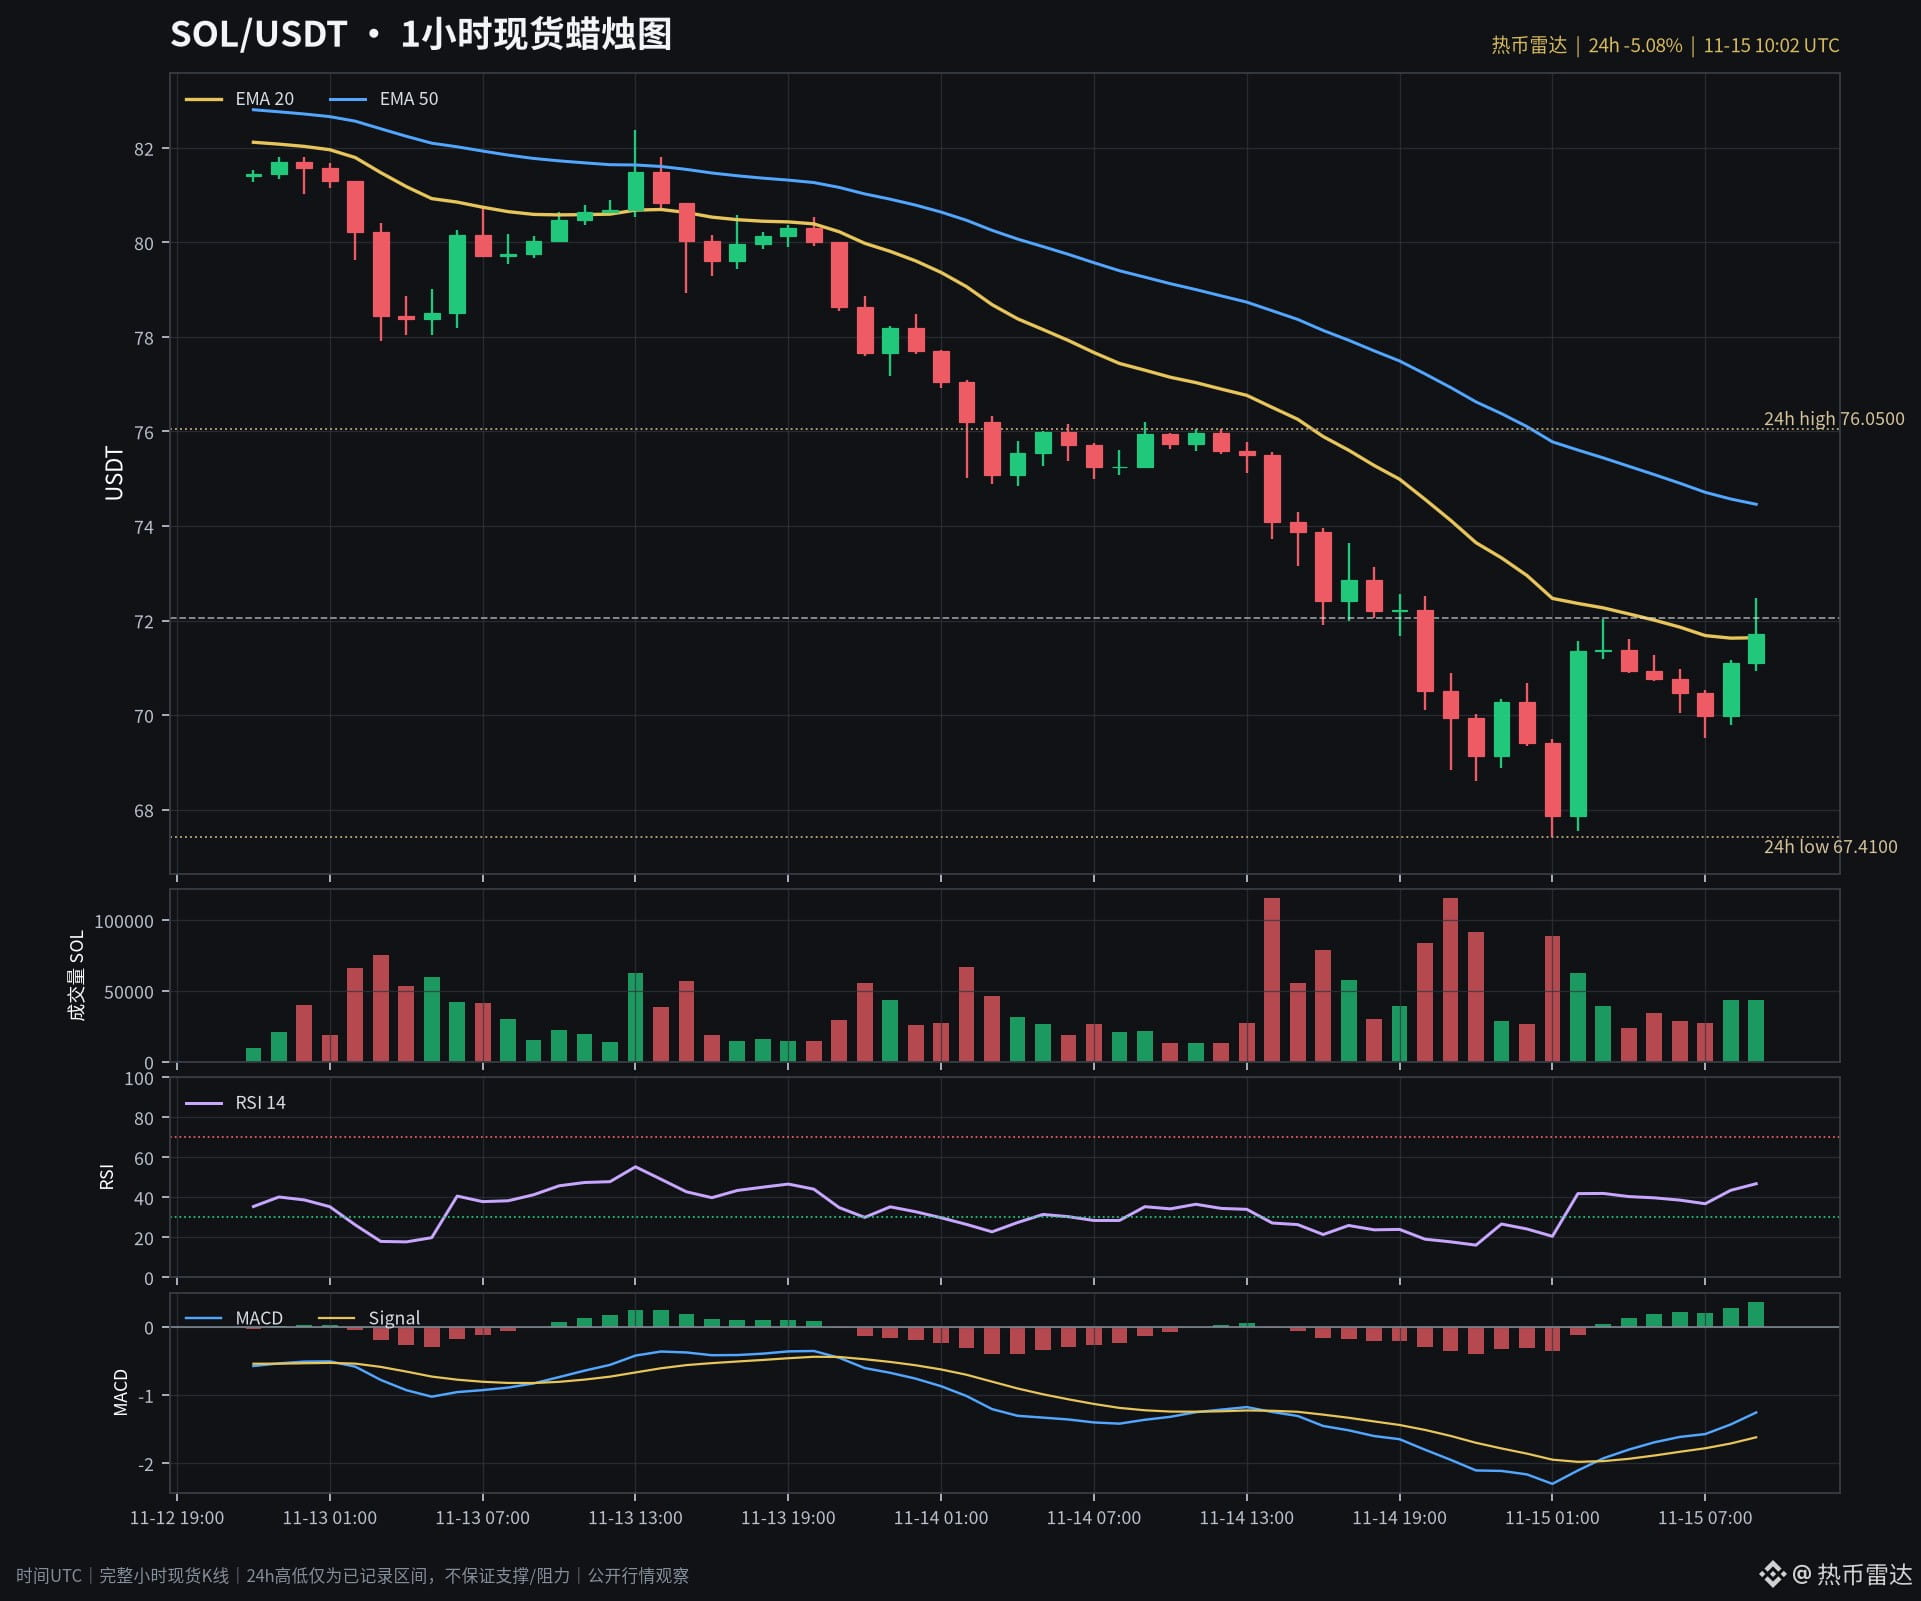
SOL has posted two consecutive bullish candles, but the second candle’s body shrank by 46%.
On November 15, from 08:00–09:00 UTC, the full hourly candle closed at 71.11, up from 69.98; from 09:00–10:00, it closed at 71.72 USDT, up from 71.11. The latter candle reached 72.47, with an upper wick of $0.75—longer than its $0.61 bullish body. Volume was about 43,000 SOL in each hour, with no obvious further increase.
The close was just above the EMA20 at about 71.64, while RSI(14) was about 46.8. Price is still recovering, but two consecutive bullish candles do not mean upward momentum is strengthening, nor does the upper wick alone confirm a top.
If a subsequent full hourly candle closes above 72.47, then holds on a retest with volume sustained, the resistance interpretation will weaken. If price falls below this candle’s low of 70.94 and fails to recover, the evidence that it has just reclaimed the moving average will weaken. Highs and lows are simply records; they do not guarantee support or resistance.
The chart shows spot 1-hour candlesticks; SOLUSDT Perp is a separate perpetual market card, and the asset label is a spot-market entry point. For market observation only; this is not a buy or sell recommendation.
$SOL
On November 15, from 08:00–09:00 UTC, the full hourly candle closed at 71.11, up from 69.98; from 09:00–10:00, it closed at 71.72 USDT, up from 71.11. The latter candle reached 72.47, with an upper wick of $0.75—longer than its $0.61 bullish body. Volume was about 43,000 SOL in each hour, with no obvious further increase.
The close was just above the EMA20 at about 71.64, while RSI(14) was about 46.8. Price is still recovering, but two consecutive bullish candles do not mean upward momentum is strengthening, nor does the upper wick alone confirm a top.
If a subsequent full hourly candle closes above 72.47, then holds on a retest with volume sustained, the resistance interpretation will weaken. If price falls below this candle’s low of 70.94 and fails to recover, the evidence that it has just reclaimed the moving average will weaken. Highs and lows are simply records; they do not guarantee support or resistance.
The chart shows spot 1-hour candlesticks; SOLUSDT Perp is a separate perpetual market card, and the asset label is a spot-market entry point. For market observation only; this is not a buy or sell recommendation.
$SOL