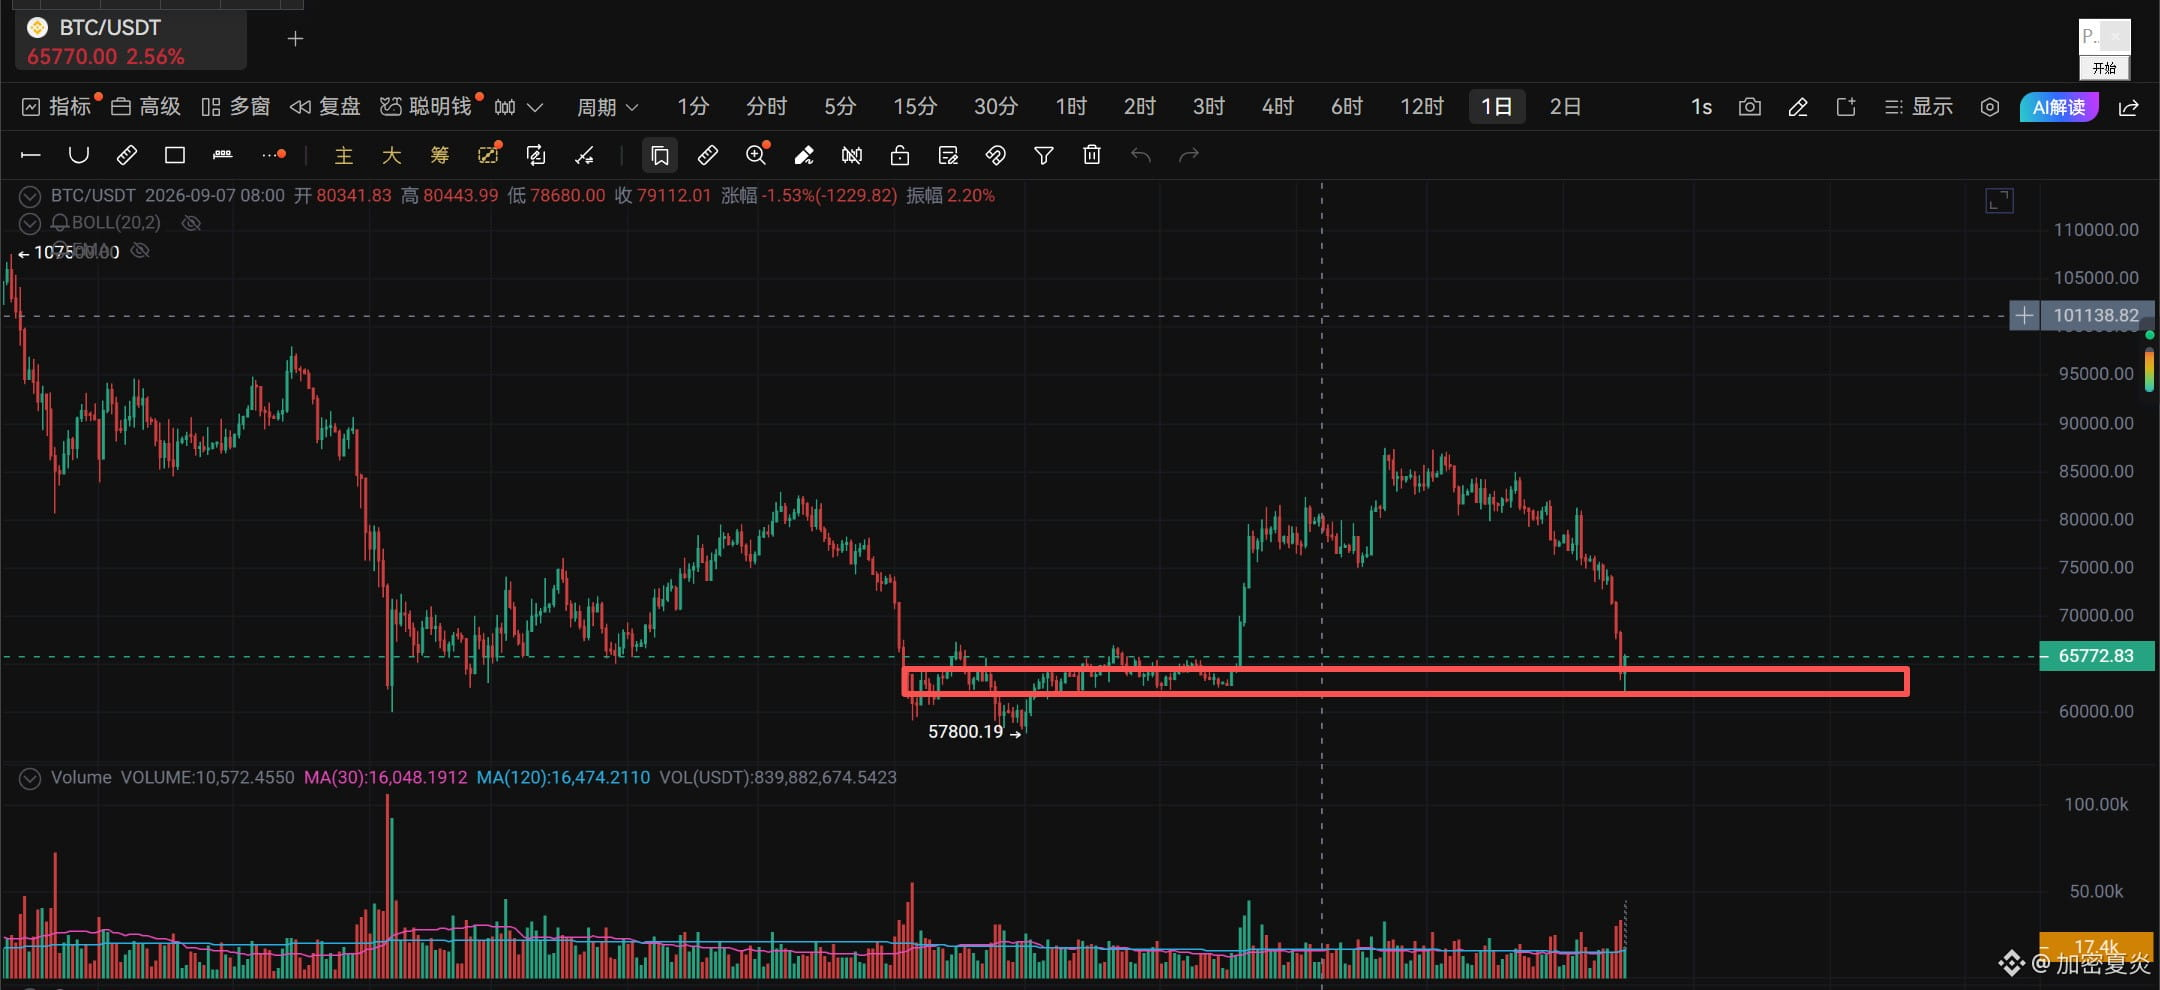
Nov. 16 market analysis:
Bitcoin fell below 63,000, hitting a low of 62,181—the lowest since Aug. 17. In 24 hours, 336,700 traders were liquidated, totaling $2.123 billion; BTC long positions accounted for 92% of liquidations!
The immediate trigger for this drop was technical: breaking below the 200-day moving average at 73,000 sparked massive liquidations. Macroeconomic factors were just the backdrop: both CPI and PPI came in above expectations, with year-over-year PPI at +6.5%, its highest in nearly four years. BofA pushed its rate-hike forecast out to January 2027; from Oct. 30 to Nov. 13, ETFs saw nearly $3 billion in net outflows as institutional buying dried up.
Since Oct. 21, the price has fallen 25%; it is down 49.44% from its all-time high, nearly cut in half. But it’s still up 1.21% over three months—the August rally is what’s been erased.
Looking down: 62,000 is the level being tested now, followed by 58,597. The 57,742 level (the year-to-date low on July 1) is key support. Looking up: 64,813, 68,400, and 72,000–73,000 mark the upper limit of this rebound—a confluence of the 200-day moving average and the 0.618 Fibonacci level. Plus, 73% of recent buyers are still underwater above here. Don’t chase shorts at 62,000; buy spot here—the short-term outlook is a rebound, not a reversal! #加密市场大幅回调,多名巨鲸遭遇清算 #美国现货XRPETF周流出创8个月新高 $BTC
Bitcoin fell below 63,000, hitting a low of 62,181—the lowest since Aug. 17. In 24 hours, 336,700 traders were liquidated, totaling $2.123 billion; BTC long positions accounted for 92% of liquidations!
The immediate trigger for this drop was technical: breaking below the 200-day moving average at 73,000 sparked massive liquidations. Macroeconomic factors were just the backdrop: both CPI and PPI came in above expectations, with year-over-year PPI at +6.5%, its highest in nearly four years. BofA pushed its rate-hike forecast out to January 2027; from Oct. 30 to Nov. 13, ETFs saw nearly $3 billion in net outflows as institutional buying dried up.
Since Oct. 21, the price has fallen 25%; it is down 49.44% from its all-time high, nearly cut in half. But it’s still up 1.21% over three months—the August rally is what’s been erased.
Looking down: 62,000 is the level being tested now, followed by 58,597. The 57,742 level (the year-to-date low on July 1) is key support. Looking up: 64,813, 68,400, and 72,000–73,000 mark the upper limit of this rebound—a confluence of the 200-day moving average and the 0.618 Fibonacci level. Plus, 73% of recent buyers are still underwater above here. Don’t chase shorts at 62,000; buy spot here—the short-term outlook is a rebound, not a reversal! #加密市场大幅回调,多名巨鲸遭遇清算 #美国现货XRPETF周流出创8个月新高 $BTC