
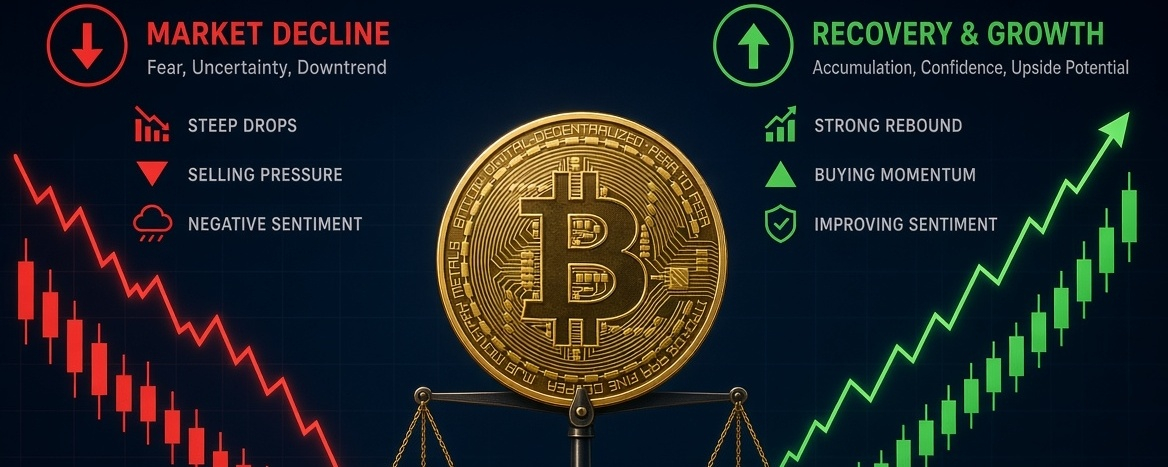

Do we sell at a loss or wait for the market to recover?
When capital is tied up in a position that has fallen sharply, the most painful question is simple: do I cut my losses now and free up the money, or hold on and wait for the market to recover? There’s no universal answer. Everyone has their own time horizon, risk tolerance, and liquidity needs. What we can do is look at concrete data on what happened to Bitcoin after its steepest downturns, so the decision can be made as clearly as possible—not based solely on the fear of the moment.
**📉 WHAT HAPPENED AFTER THE DEEPEST DRAWDOWNS IN $BTC ?**
Bitcoin has had several periods when its price fell more than 50% from an all-time high. The deepest were full-cycle drawdowns and show a clear recovery pattern, although they involved long waiting periods.
**💥 THE 2011 DRAWDOWN (MT. GOX)**
In 2011, after reaching nearly $32, Bitcoin fell to around $2 (a loss of approximately 93–94%). The bottom was reached in November of that year, and it took the price 15 to 20 months to surpass its previous high again, which happened in early 2013. In percentage terms, this was the most brutal drawdown in Bitcoin's entire history.
**📉 THE 2013–2015 DRAWDOWN**
Between late 2013 and early 2015, the price fell from around $1,132–$1,163 to about $170 (a drop of 85%). The bottom was reached in January 2015, and the next all-time high did not arrive until February 2017—about 24–25 months after the low. This period coincided with the collapse of Mt. Gox and was one of the longest bear markets.
**❄️ THE 2017–2018 DRAWDOWN**
In the 2017–2018 cycle, Bitcoin fell from around $19,200–$19,800 to about $3,180–$3,200 (around 83–84%). The bottom was reached in December 2018, and the price did not recover that level until late November 2020, approximately 23–24 months later. This marked the end of the ICO craze.
**📉 THE 2021–2022 DRAWDOWN**
In the most recent 2021–2022 cycle, the price fell from around $67,500–$69,000 to about $15,500–$16,000 (a drop of 77%). The low was recorded in November 2022, and the next all-time high arrived in March 2024, about 15–16 months after the bottom. This was the first major bear market in which the recovery was somewhat faster than in previous cycles.
**⚡ SHORT-TERM DROPS WITHIN BULL CYCLES**
There have also been shorter, sharper drops that did not form a complete bear market cycle. The COVID crash in March 2020 and the drop in mid-2021 (around 53–55%) recovered within 3 to 5 months because the overall market context remained bullish. These do not behave like the major cycle drawdowns.
**📊 REPEATING PATTERNS IN HISTORY**
One recurring pattern is that each major bear market has been slightly less severe than the previous one in percentage terms: 94% in 2011, 85% in 2013–2015, 84% in 2017–2018, and 77% in 2021–2022. Historically, Bitcoin has recovered all its previous highs and gone on to set new records. There is no record of it failing to recover from a deep drawdown, although the wait has been long and painful in full-cycle cases. In major bear markets, recovery to the previous high has taken between 15 and 25 months from the bottom.
**📍 CURRENT SITUATION (NOVEMBER 2026)**
At the time of writing, Bitcoin reached its all-time high around October 6, 2025, at approximately $124,700–$126,200. It fell by approximately 53% to a low near $58,500 in late June 2026. As of the date of this text, the price is around $64,000, representing a loss of about 49% from the high. It has not yet recovered the October 2025 record. For now, this drop is shallower than the major bear markets of previous cycles.
**🤔 KEY FACTORS TO CONSIDER**
Anyone who is stuck should consider several factors before deciding. The first is their actual time horizon: if they need the money in the coming months, the history of long recoveries (more than a year from the bottom) may not be compatible with that need. If the capital can remain tied up for 12 to 24 months or longer, history shows that in previous cases the prior high was recovered. The second factor is the relative depth of the drop: a 50% decline is not the same as one of 80% or more; the deeper declines have taken longer to recover. The third is personal circumstances: if the position represents a very large share of total assets and causes constant anxiety, selling some or all of it may be a risk-management decision, regardless of what the historical record suggests. If it is capital that you can afford to have temporarily at risk and your goal is long-term, the history of full recoveries provides a useful point of reference.
**✅ CONCLUSION**
No past data guarantees the future. Previous cycles unfolded in a context of lower institutional adoption, with no U.S. spot Bitcoin ETFs and a much smaller market. The current cycle has those features, which some interpret as factors that could shorten or soften downturns, although they do not eliminate the risk that recovery could take longer. The final decision to sell at a loss or wait is not made by historical data: each person makes it based on their circumstances, their ability to tolerate losses, and their need for liquidity. Information about previous drawdowns is useful only insofar as it helps people make that decision with their eyes open to how long it has taken to recover lost ground in the past.