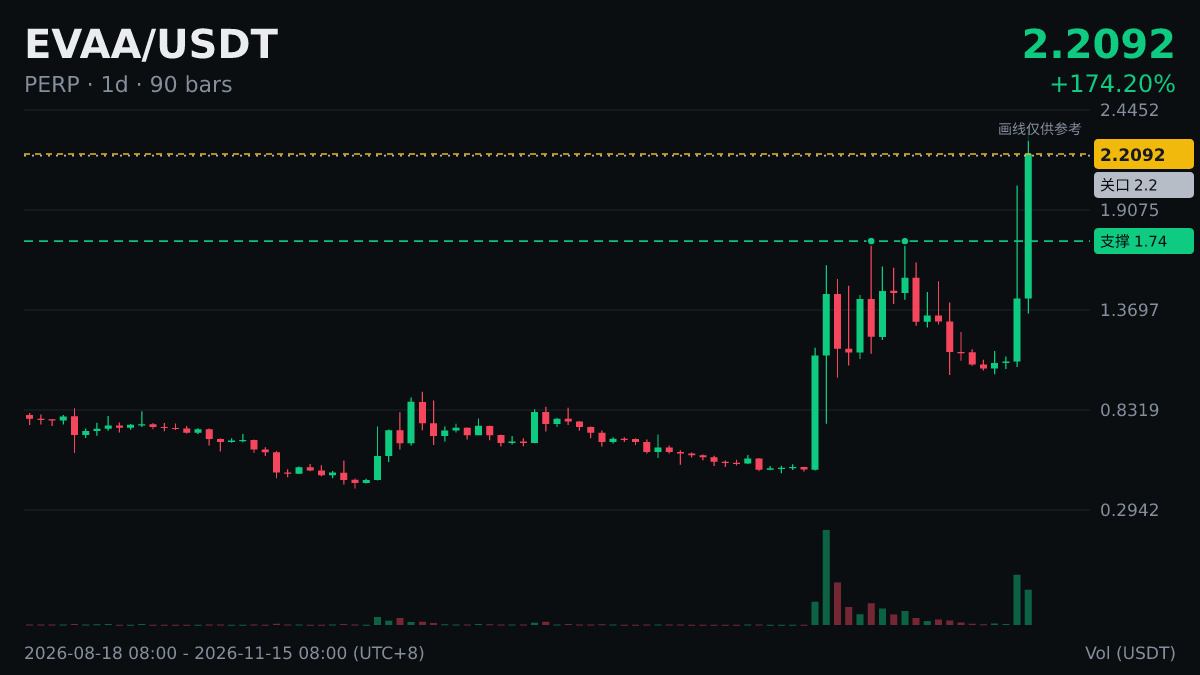
$EVAA Daily RSI is 76.5, in overbought territory.
Let’s use this figure to break down the RSI.
In the classic interpretation, an RSI above 70 is considered overbought, while below 30 is considered oversold; some traders use 80 / 20 as stricter thresholds.
“Divergence” is another commonly discussed way to read the RSI: when the price makes a new high but the RSI doesn’t, it’s often seen as a sign that upward momentum is weakening. But divergence can persist through multiple swings.
Learning to read indicators isn’t hard; the hard part is sticking to your plan when emotions run high.
You’re responsible for your own risk—just chatting.
Let’s use this figure to break down the RSI.
In the classic interpretation, an RSI above 70 is considered overbought, while below 30 is considered oversold; some traders use 80 / 20 as stricter thresholds.
“Divergence” is another commonly discussed way to read the RSI: when the price makes a new high but the RSI doesn’t, it’s often seen as a sign that upward momentum is weakening. But divergence can persist through multiple swings.
Learning to read indicators isn’t hard; the hard part is sticking to your plan when emotions run high.
You’re responsible for your own risk—just chatting.