$BTC At the lower edge, a bounce: volume is there, but no reversal
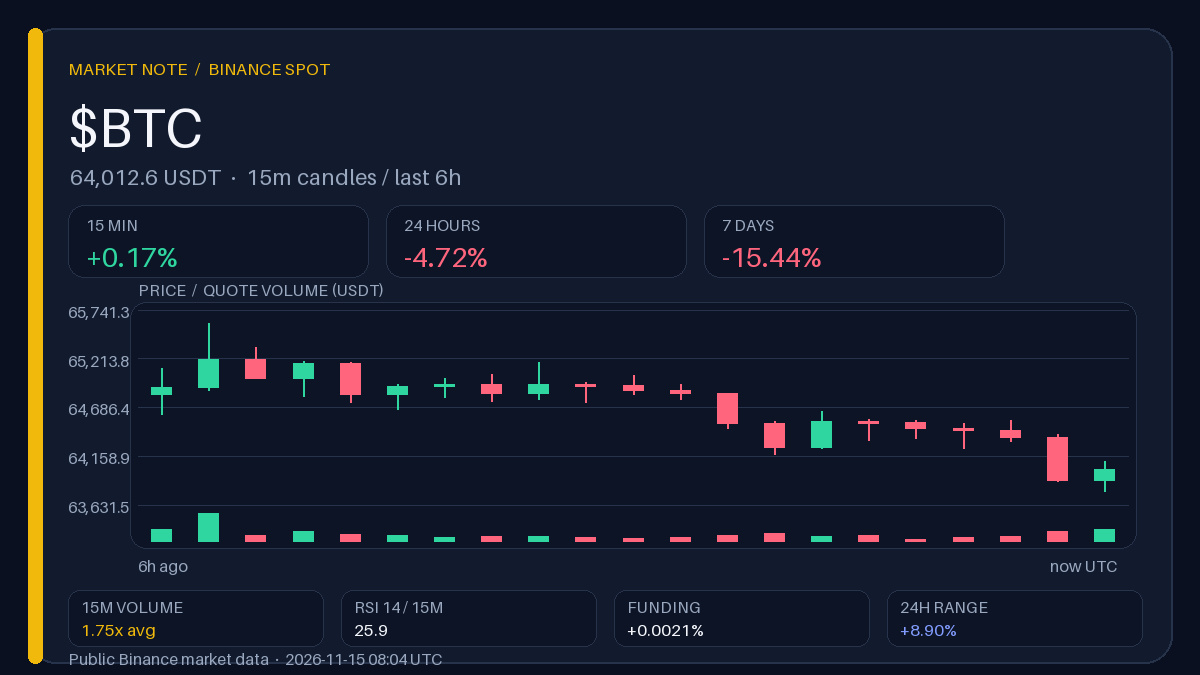
A volume spike on the 15-minute chart shows activity, but it doesn’t erase the weekly loss: the price is still at the lower boundary of the local range. An RSI of 25.9 on the 15-minute chart indicates oversold conditions, but funding at +0.0021% shows no overcrowding—this looks more like a bounce than a trend reversal.
Observation range · 5 h
Above 65,595.77: A close above the upper boundary of the local range would confirm that momentum has turned into a recovery.
Below 63,777.00: A return to the lower boundary would show that the volume was merely a burst of activity, with no change in direction.
These are historical levels; a single wick does not confirm the scenario.
↩️ Recap of the previous “Volume Radar” edition (14 Nov, 03:49 UTC): BTC 66,881.96 → 65,638.97 USDT (−1.86% in 12 h), funding 0.000% → +0.004%.
What would need to change in funding for this volume spike to signal a reversal rather than noise?
Binance data, snapshot at 08:04 UTC. The author may receive a reward through Binance Square Write to Earn.
A volume spike on the 15-minute chart shows activity, but it doesn’t erase the weekly loss: the price is still at the lower boundary of the local range. An RSI of 25.9 on the 15-minute chart indicates oversold conditions, but funding at +0.0021% shows no overcrowding—this looks more like a bounce than a trend reversal.
Observation range · 5 h
Above 65,595.77: A close above the upper boundary of the local range would confirm that momentum has turned into a recovery.
Below 63,777.00: A return to the lower boundary would show that the volume was merely a burst of activity, with no change in direction.
These are historical levels; a single wick does not confirm the scenario.
↩️ Recap of the previous “Volume Radar” edition (14 Nov, 03:49 UTC): BTC 66,881.96 → 65,638.97 USDT (−1.86% in 12 h), funding 0.000% → +0.004%.
What would need to change in funding for this volume spike to signal a reversal rather than noise?
Binance data, snapshot at 08:04 UTC. The author may receive a reward through Binance Square Write to Earn.