

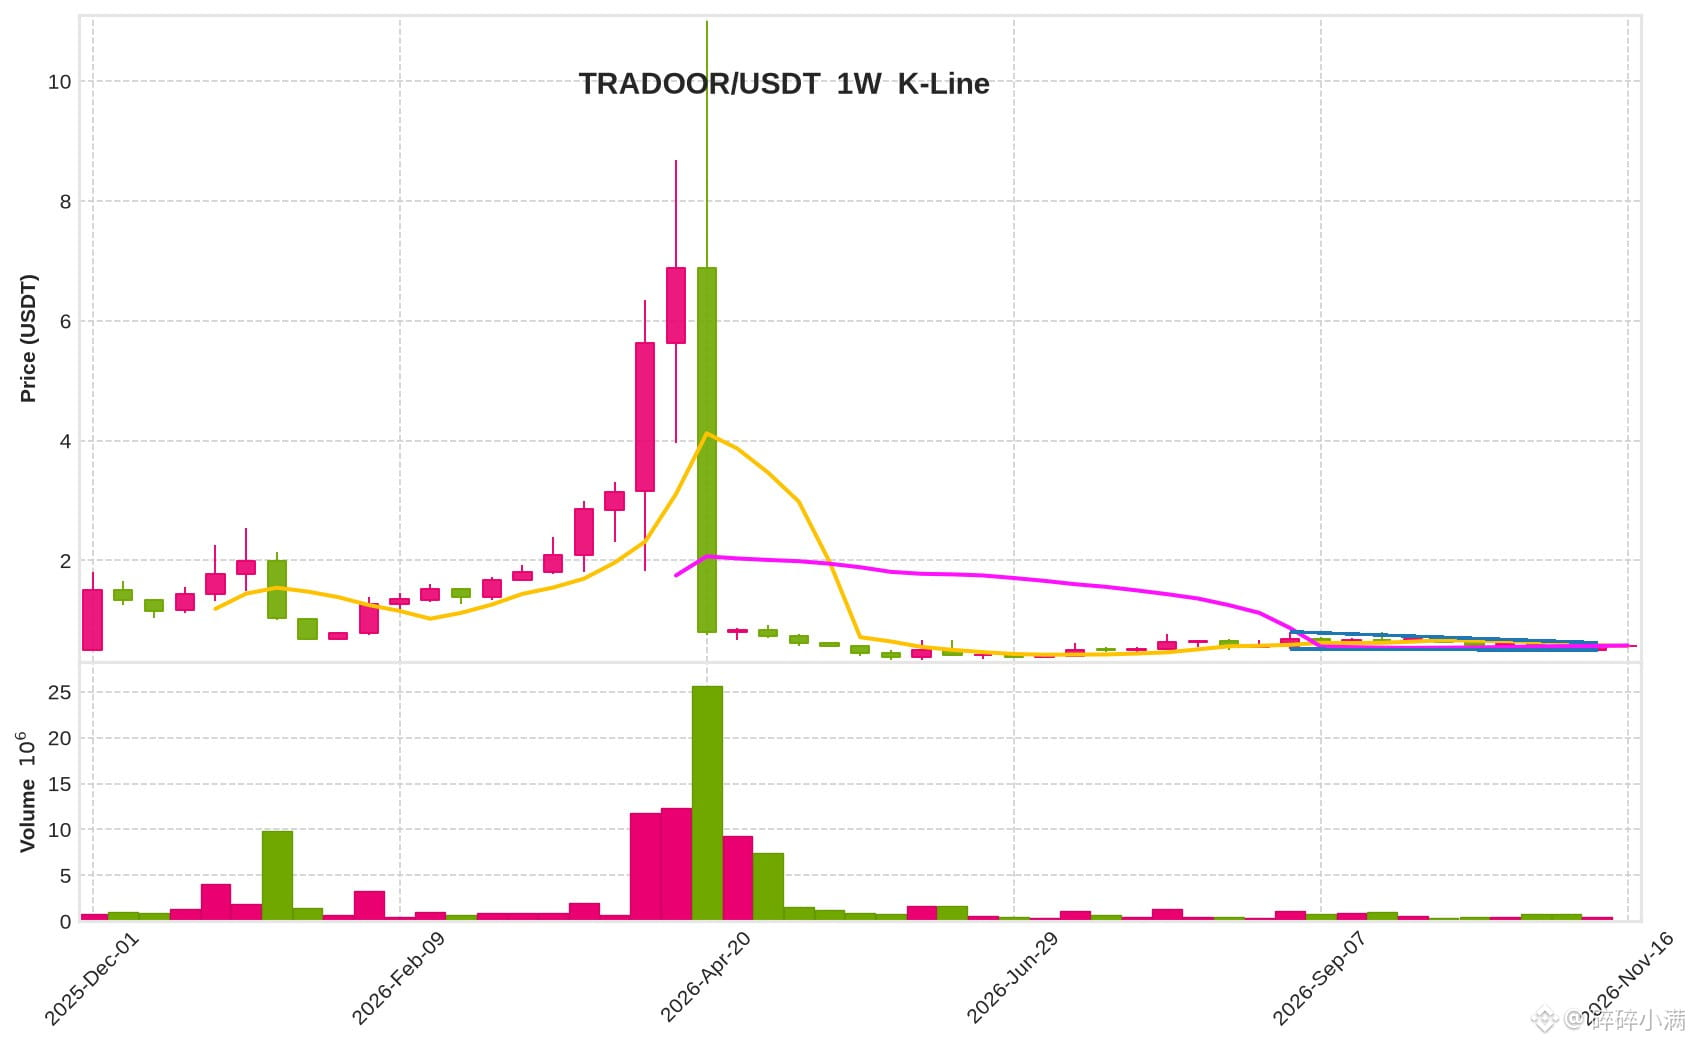
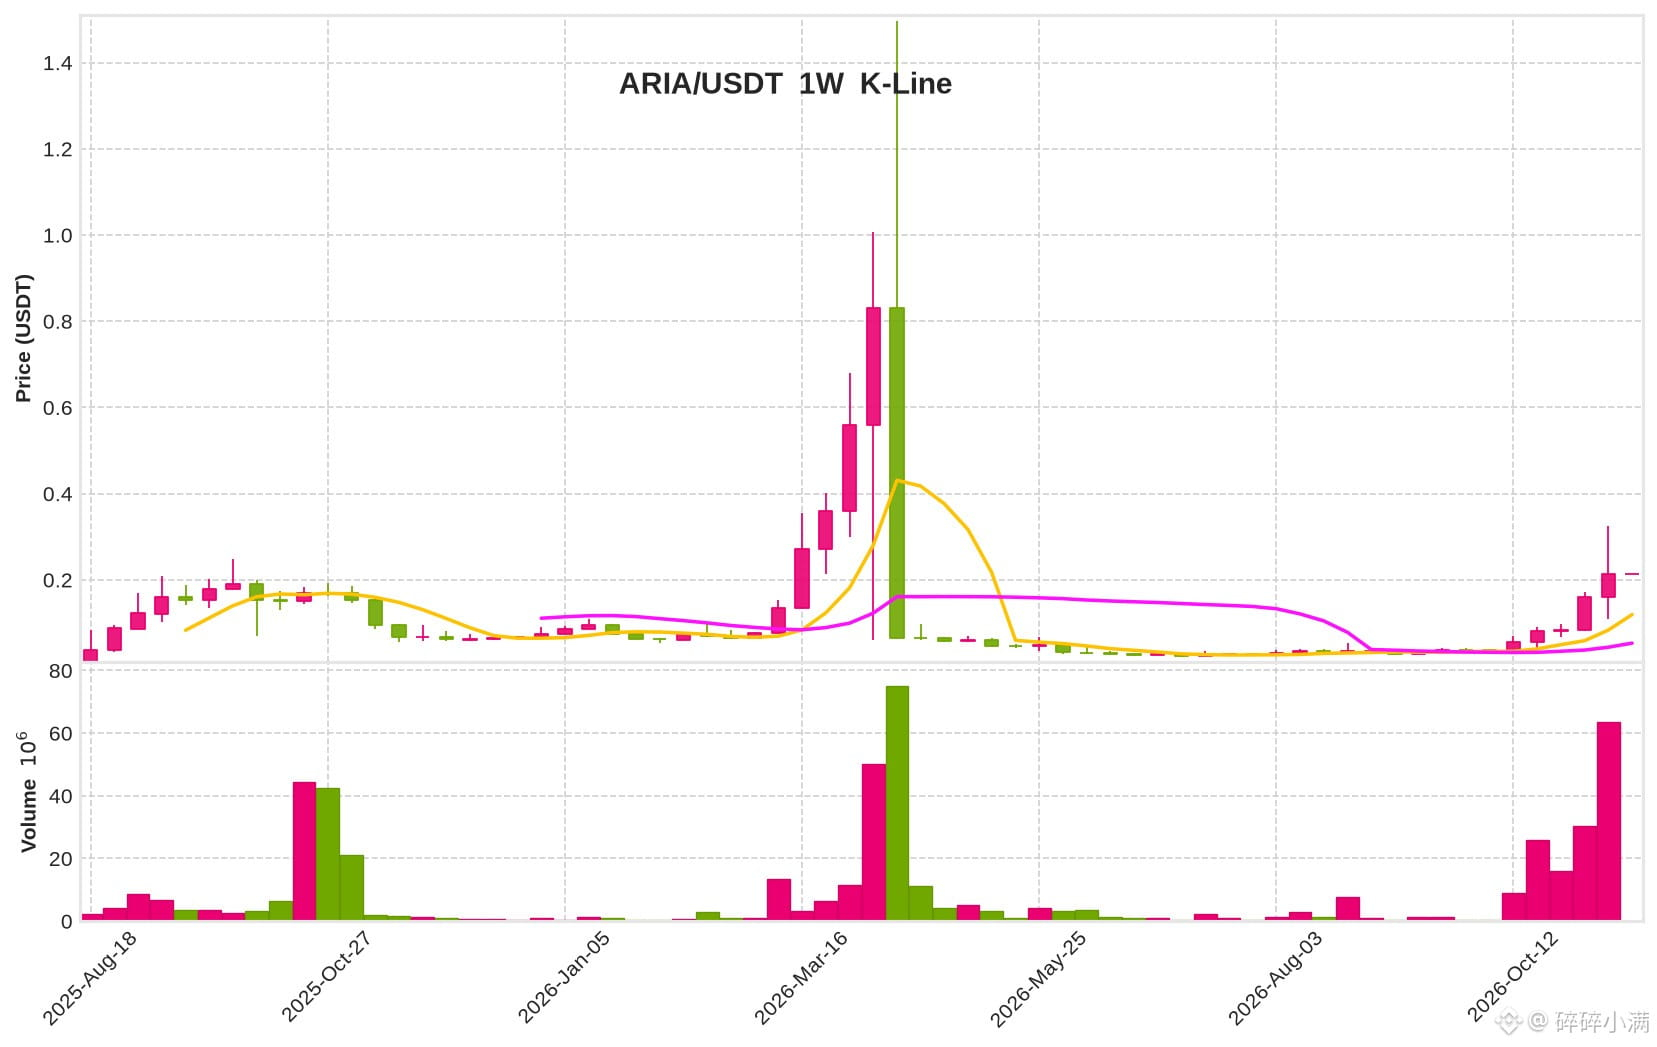
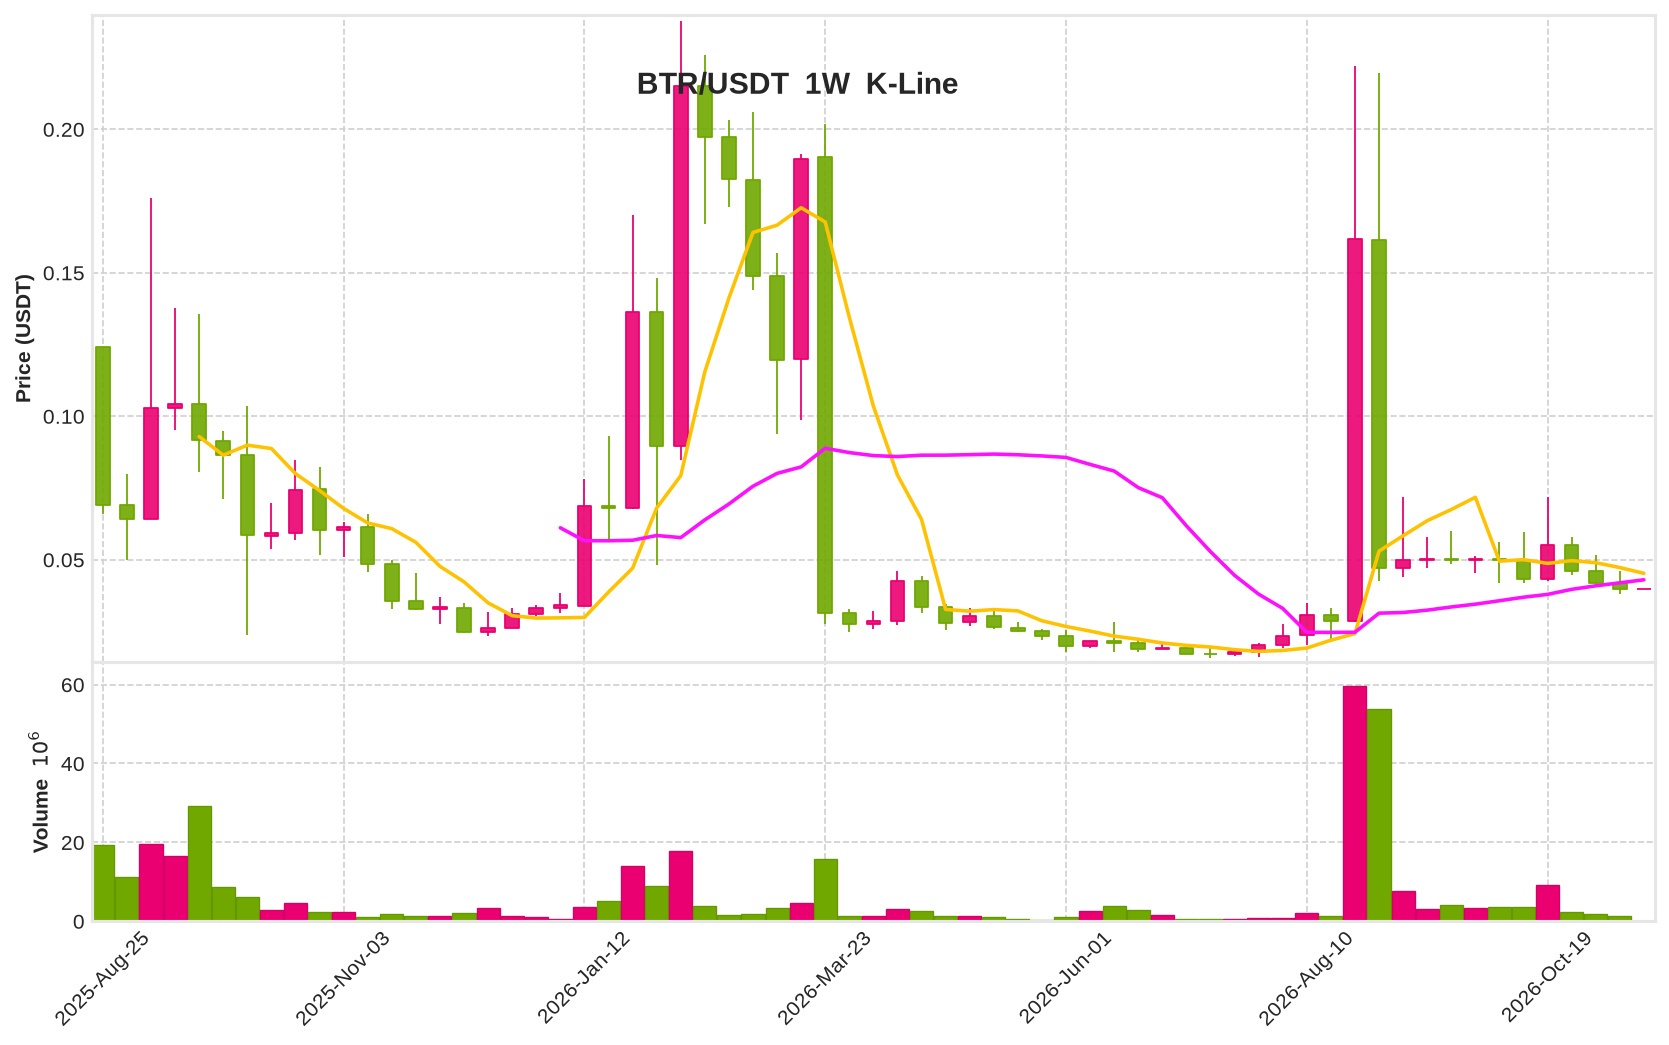
This chart from a foreign trader is pretty interesting. $ARIA and $BTR both had the same pattern before: first a sharp crash, then months of consolidating into a converging triangle at the bottom, followed by one huge bullish candle that sent the price soaring—that’s how they went 10x. Now $TRADOOR looks just like that. It’s been moving sideways around 0.57 for over two months, with lower highs and higher lows; the triangle is getting tighter and trading volume has dried up. $ARIA has already made its move, rising from 0.03 to 0.21, and $BTR previously went from 0.02 to 0.23. Can $TRADOOR do the same? Watch to see whether it can break above 0.65 on strong volume this week—if it does, that could open the way up.
Join global crypto users on Binance Square
⚡️ Get latest and useful information about crypto.
💬 Trusted by the world’s largest crypto exchange.
👍 Discover real insights from verified creators.
Email / Phone number