
Bitcoin's recent correction is creating a historical comparison that I don't think the market should ignore.
Something interesting is happening ahead of Anthropic's expected IPO.
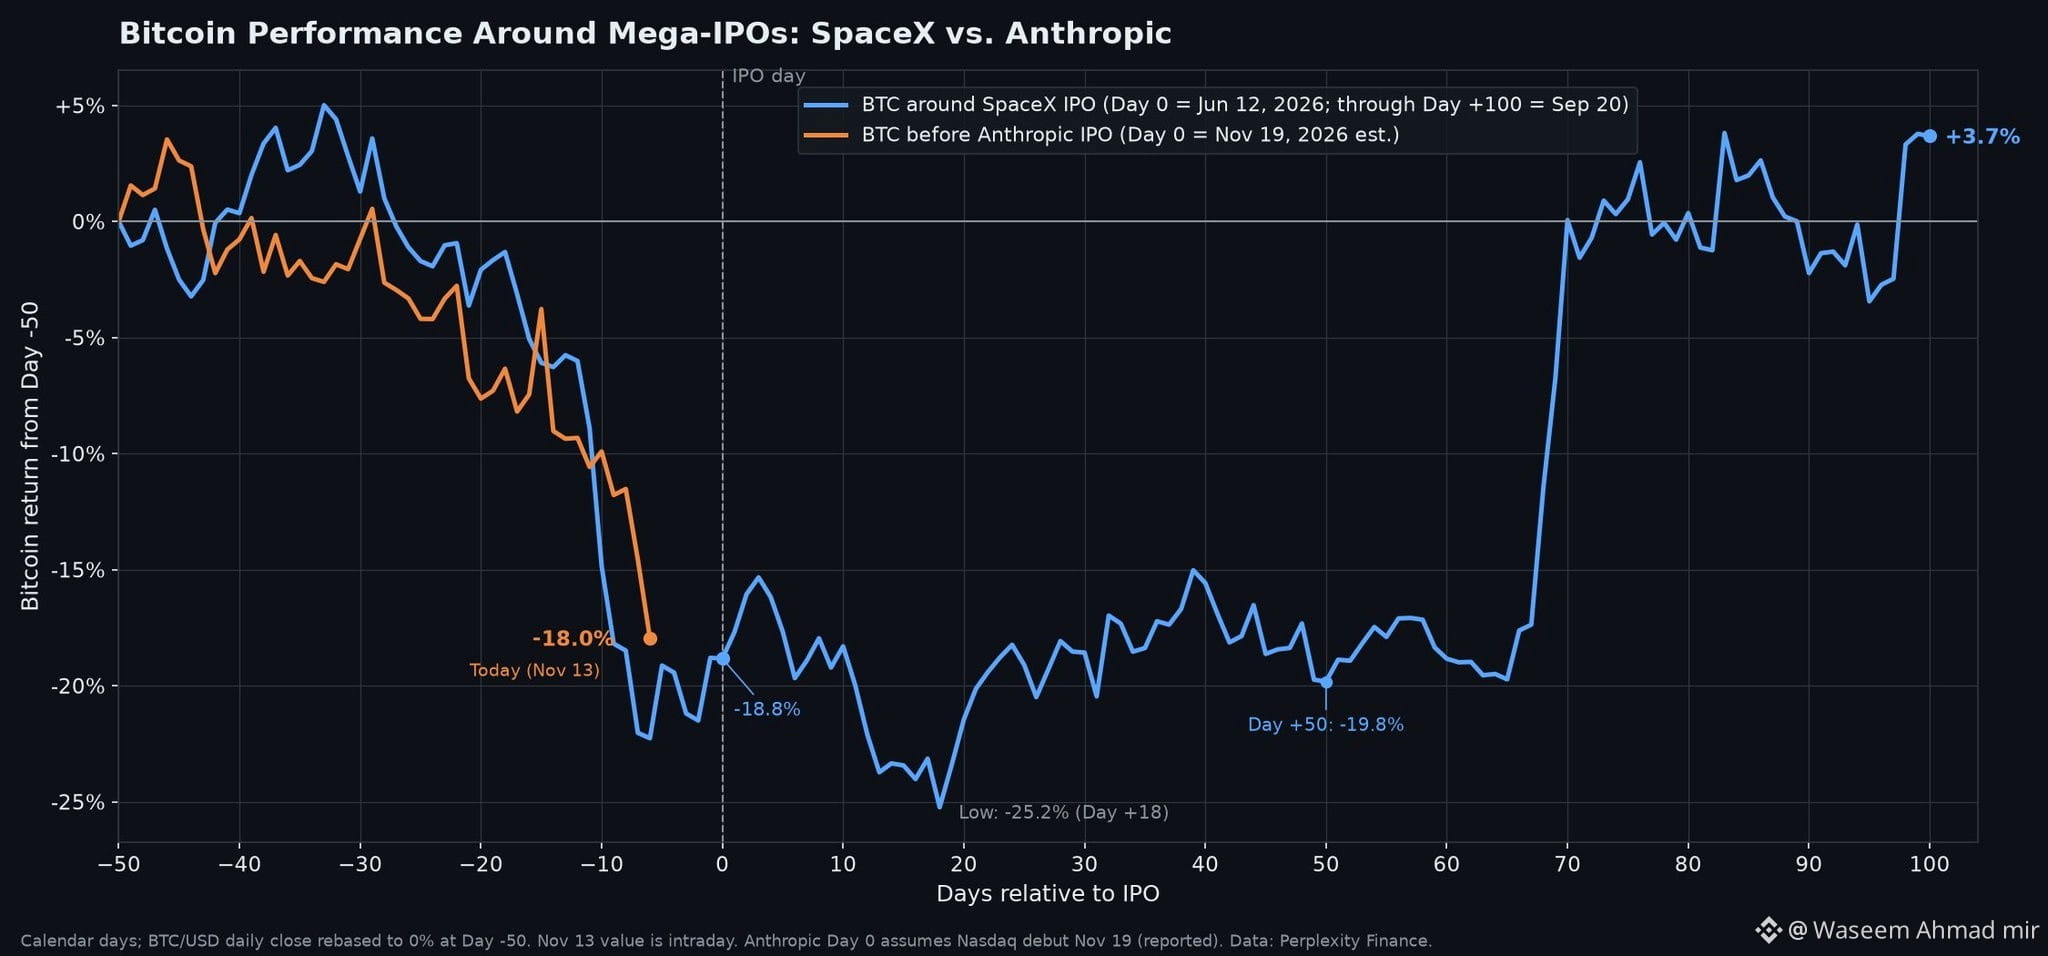
The chart compares Bitcoin's performance before two major public listings: SpaceX and Anthropic. Despite the different market environments, their price movements before the expected listing dates look remarkably similar.
Here's what stands out.
Before the SpaceX IPO, Bitcoin declined approximately 18.8% by Day 0. But the selling didn't stop immediately. BTC eventually reached a deeper drawdown of 25.2% on Day 18.
The recovery came later.
By Day 50, Bitcoin was still down approximately 19.8%. Then momentum shifted sharply, and by Day 100, BTC had moved into positive territory, finishing around 3.7% above its Day -50 starting point.
Now compare that with the orange line.
Bitcoin is down approximately 18% as of November 13, approaching Anthropic's estimated November 19 listing date.
The similarity raises an important question: Are we seeing another period of heavy selling before a potential market recovery?
I wouldn't assume the same pattern will repeat. Historical comparisons are useful for identifying possibilities, not predicting exact outcomes.
However, if Bitcoin finds strong support and buyers regain control, the next few weeks could become particularly interesting.
My focus is on whether BTC can establish a sustainable bottom, reclaim important resistance levels and build enough momentum for a broader recovery.
The $90K region is an interesting upside scenario if a similar trajectory develops, but confirmation from price action is essential.
For now, I'm watching the market rather than treating the historical pattern as a guarantee.
Sometimes the most important opportunity appears when market sentiment is at its weakest. Could Bitcoin be approaching that moment again?
#CryptoSelloffTriggersMultipleWhaleLiquidations
Something interesting is happening ahead of Anthropic's expected IPO.
The chart compares Bitcoin's performance before two major public listings: SpaceX and Anthropic. Despite the different market environments, their price movements before the expected listing dates look remarkably similar.
Here's what stands out.
Before the SpaceX IPO, Bitcoin declined approximately 18.8% by Day 0. But the selling didn't stop immediately. BTC eventually reached a deeper drawdown of 25.2% on Day 18.
The recovery came later.
By Day 50, Bitcoin was still down approximately 19.8%. Then momentum shifted sharply, and by Day 100, BTC had moved into positive territory, finishing around 3.7% above its Day -50 starting point.
Now compare that with the orange line.
Bitcoin is down approximately 18% as of November 13, approaching Anthropic's estimated November 19 listing date.
The similarity raises an important question: Are we seeing another period of heavy selling before a potential market recovery?
I wouldn't assume the same pattern will repeat. Historical comparisons are useful for identifying possibilities, not predicting exact outcomes.
However, if Bitcoin finds strong support and buyers regain control, the next few weeks could become particularly interesting.
My focus is on whether BTC can establish a sustainable bottom, reclaim important resistance levels and build enough momentum for a broader recovery.
The $90K region is an interesting upside scenario if a similar trajectory develops, but confirmation from price action is essential.
For now, I'm watching the market rather than treating the historical pattern as a guarantee.
Sometimes the most important opportunity appears when market sentiment is at its weakest. Could Bitcoin be approaching that moment again?
#CryptoSelloffTriggersMultipleWhaleLiquidations