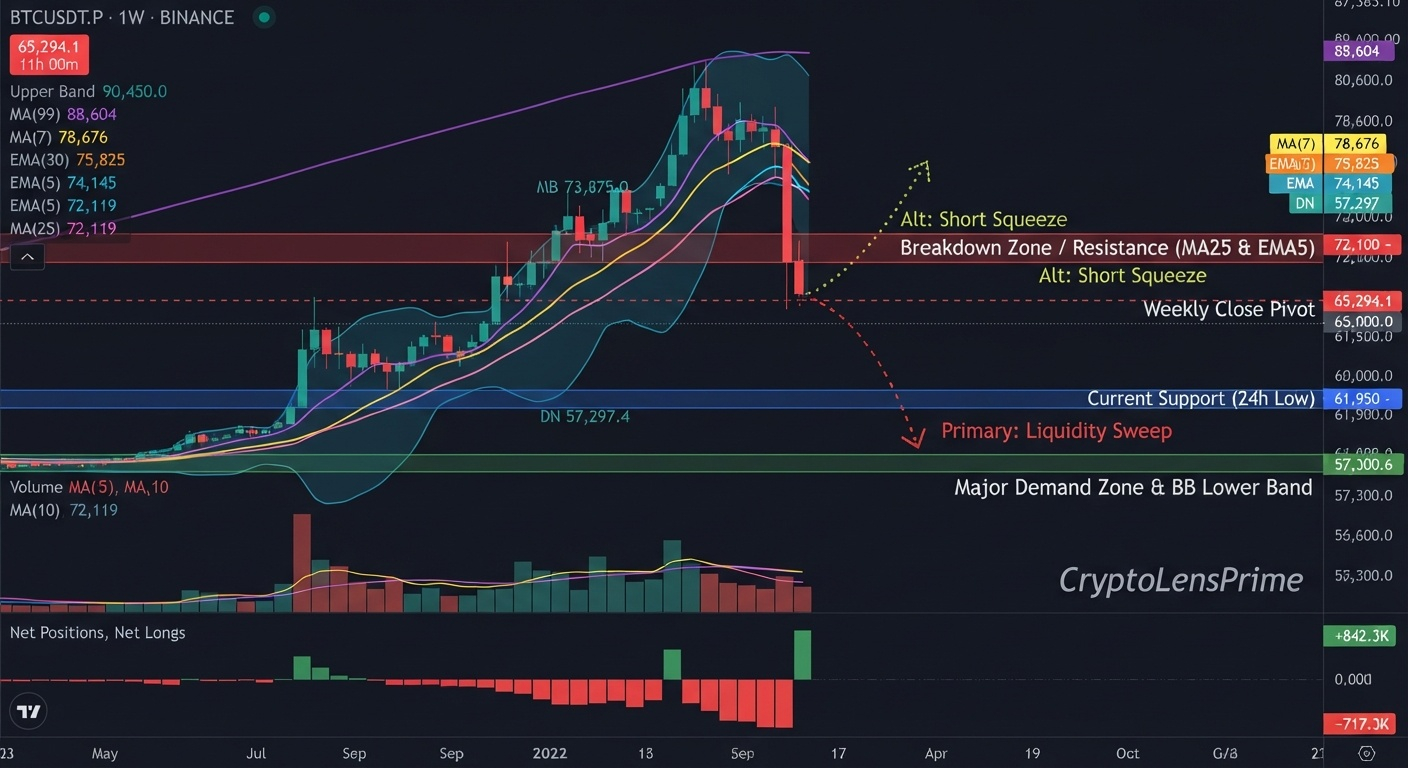
Bitcoin on the weekly timeframe (1W) is giving us signals we need to pay attention to, and the technical picture right now is anything but reassuring for buyers! 👀
This phase calls for patience and monitoring, and most importantly, we shouldn't get ahead of the chart with our predictions.
Imagine buying 1 BTC at $64,860 and watching it rise toward the following targets:
🎯 $78,900 🎯 $94,260 🎯 $105,700 🚀 $125,000
🫣🫣💫Sooner or later, BTC will reach 100k
In the crypto market... sometimes patience is stronger than any trade!$BTC
#BTC Bitcoin under pressure... Is $57,000 now on the table?!
Everyone, let's talk numbers and read the chart as it is, without excessive optimism or fear!
📉 First: What is the price telling us?
The price is currently around $65,004, and the decline shows that sellers have become stronger than buyers' ability to defend previous levels.
Key levels to watch
🔴 $57,758
A pivotal support zone. If selling pressure continues, we may see it tested, making it one of the most important areas to watch for the price reaction.
🟠 $65,000
The current battleground. Holding above it or failing to do so will be significant for the next price move.
🟢 $72,000–$75,000
This zone is the key to regaining positive momentum.
If Bitcoin can break above it and hold there with a strong weekly close, we may see the beginning of a real improvement in the technical structure.
#Bitcoin❗ #BinanceSquareTalks #BTC突破7万大关 #BTC、
This phase calls for patience and monitoring, and most importantly, we shouldn't get ahead of the chart with our predictions.
Imagine buying 1 BTC at $64,860 and watching it rise toward the following targets:
🎯 $78,900 🎯 $94,260 🎯 $105,700 🚀 $125,000
🫣🫣💫Sooner or later, BTC will reach 100k
In the crypto market... sometimes patience is stronger than any trade!$BTC
#BTC Bitcoin under pressure... Is $57,000 now on the table?!
Everyone, let's talk numbers and read the chart as it is, without excessive optimism or fear!
📉 First: What is the price telling us?
The price is currently around $65,004, and the decline shows that sellers have become stronger than buyers' ability to defend previous levels.
Key levels to watch
🔴 $57,758
A pivotal support zone. If selling pressure continues, we may see it tested, making it one of the most important areas to watch for the price reaction.
🟠 $65,000
The current battleground. Holding above it or failing to do so will be significant for the next price move.
🟢 $72,000–$75,000
This zone is the key to regaining positive momentum.
If Bitcoin can break above it and hold there with a strong weekly close, we may see the beginning of a real improvement in the technical structure.
#Bitcoin❗ #BinanceSquareTalks #BTC突破7万大关 #BTC、