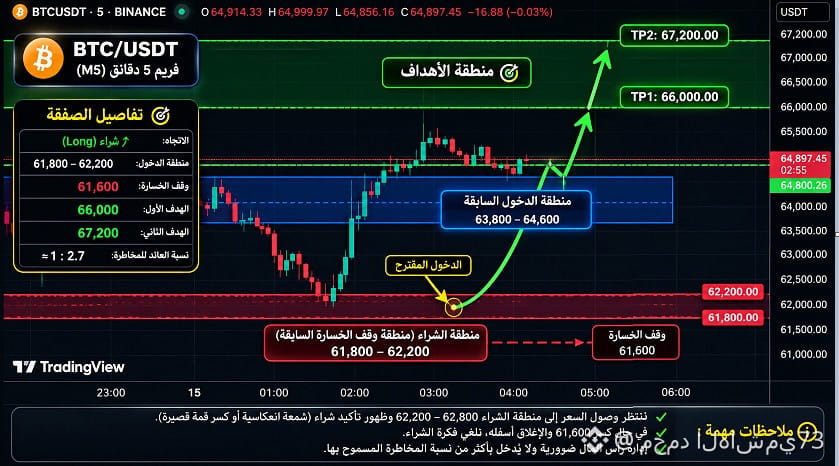
The trade we identified on the BTC/USDT 5-minute chart is a potential buy setup after a pullback, aiming to benefit from a price rebound to higher levels.
But it’s important to understand that this is a conditional plan, not a confirmed buy trade.
Trade details
BTC/USDT — Potential buy
Long
Suggested buy zone
$61,800–$62,200
Suggested stop-loss
$61,600
First target
$66,000
Second target
$67,200
How should we manage the trade?
Wait for a pullback: The price shown in the image is around $64,897. Don’t chase the price; instead, wait for it to reach the $61,800–$62,200 zone.
Watch for rebound confirmation: Look for a reversal candle or a reclaim of a support level after a false breakdown.
Entry: Only after confirmation, not simply when the price touches the zone.
Stop-loss: The $61,600 level is provisional and needs to be checked against the swing low and liquidity. A break below it and a close beneath it invalidates the buy idea under this plan.
Take profit: The first target is $66,000 and the second is $67,200, with the option to reduce part of the position at the first target.
The $61,800–$62,200 zone was the stop-loss area in the original analysis. Turning it into a buy zone is a new scenario that requires independent confirmation. Also, the risk/reward ratio shown in the image is not fixed; it changes depending on the actual execution price.
$BTC
But it’s important to understand that this is a conditional plan, not a confirmed buy trade.
Trade details
BTC/USDT — Potential buy
Long
Suggested buy zone
$61,800–$62,200
Suggested stop-loss
$61,600
First target
$66,000
Second target
$67,200
How should we manage the trade?
Wait for a pullback: The price shown in the image is around $64,897. Don’t chase the price; instead, wait for it to reach the $61,800–$62,200 zone.
Watch for rebound confirmation: Look for a reversal candle or a reclaim of a support level after a false breakdown.
Entry: Only after confirmation, not simply when the price touches the zone.
Stop-loss: The $61,600 level is provisional and needs to be checked against the swing low and liquidity. A break below it and a close beneath it invalidates the buy idea under this plan.
Take profit: The first target is $66,000 and the second is $67,200, with the option to reduce part of the position at the first target.
The $61,800–$62,200 zone was the stop-loss area in the original analysis. Turning it into a buy zone is a new scenario that requires independent confirmation. Also, the risk/reward ratio shown in the image is not fixed; it changes depending on the actual execution price.
$BTC