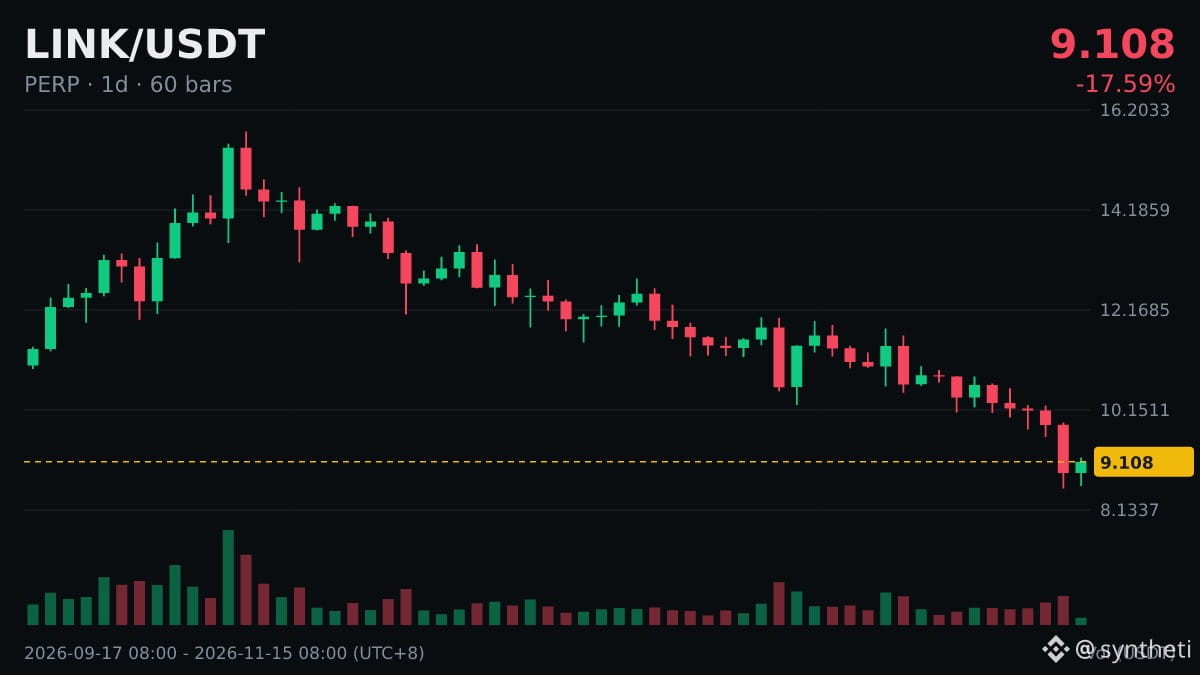
A note: $LINK has had 5 consecutive bearish daily candlesticks, down a cumulative 16.69% over that period. It’s up 2.66% so far today.
People often ask what consecutive bearish daily candlesticks mean. Here’s how I understand it.
Before today’s daily candlestick closes, it can still change from bullish to bearish or vice versa: if the price moves across the opening price during the session, a bullish candlestick can turn into a different one.
When trading volume keeps rising during a series of candlesticks, it’s often seen as a sign of sustained participation by investors. When volume keeps shrinking, it’s often seen as a sign that fewer people are following through.
The point of understanding an indicator is to avoid being misled by a single number—not to use it to predict price movements accurately.
People often ask what consecutive bearish daily candlesticks mean. Here’s how I understand it.
Before today’s daily candlestick closes, it can still change from bullish to bearish or vice versa: if the price moves across the opening price during the session, a bullish candlestick can turn into a different one.
When trading volume keeps rising during a series of candlesticks, it’s often seen as a sign of sustained participation by investors. When volume keeps shrinking, it’s often seen as a sign that fewer people are following through.
The point of understanding an indicator is to avoid being misled by a single number—not to use it to predict price movements accurately.