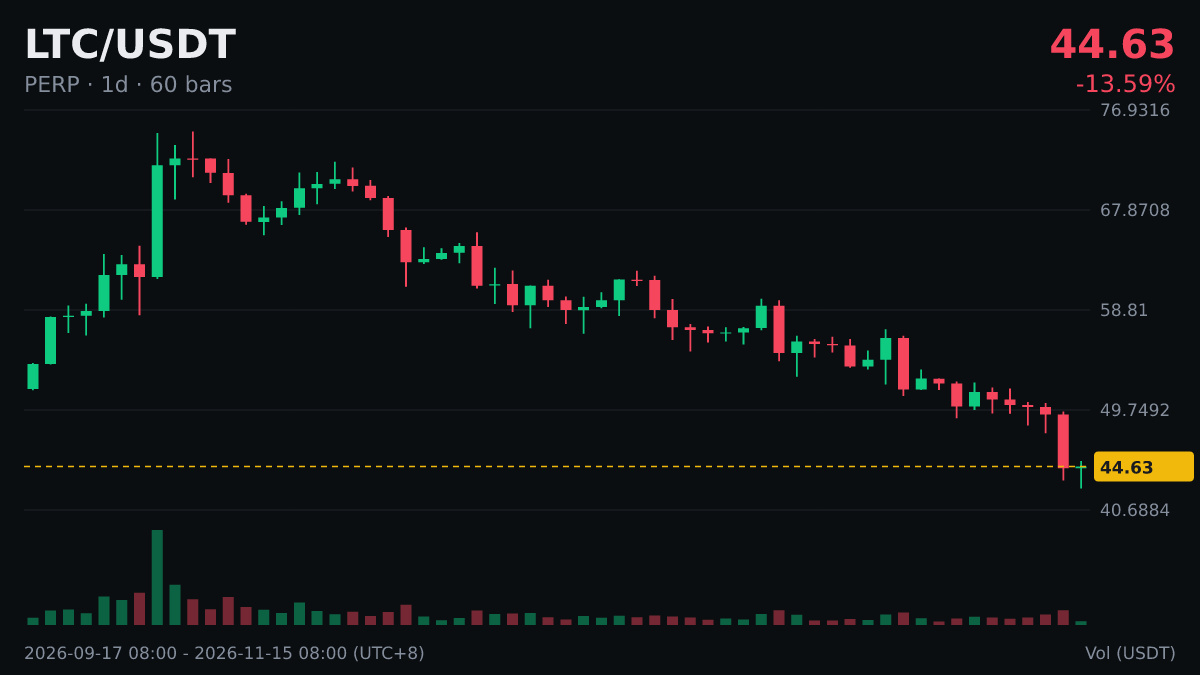
The market mini-show has updated again: $LTC has posted 5 consecutive down days on the daily chart, down a cumulative 13.47% during that period, and up 0.38% so far today.
Five straight down days—that’s more consistent than my early-morning check-ins.
A quick bit of serious education: the number of consecutive down days so far can’t tell you whether tomorrow’s candlestick will be bullish or bearish. Thinking that after so many down days, it must turn around is a common misconception.
Cross-checking multiple data points is more reliable than looking at just one, but even more indicators can’t give you a definitive conclusion.
This is a compilation of publicly available information. Please verify it for yourself.
Five straight down days—that’s more consistent than my early-morning check-ins.
A quick bit of serious education: the number of consecutive down days so far can’t tell you whether tomorrow’s candlestick will be bullish or bearish. Thinking that after so many down days, it must turn around is a common misconception.
Cross-checking multiple data points is more reliable than looking at just one, but even more indicators can’t give you a definitive conclusion.
This is a compilation of publicly available information. Please verify it for yourself.