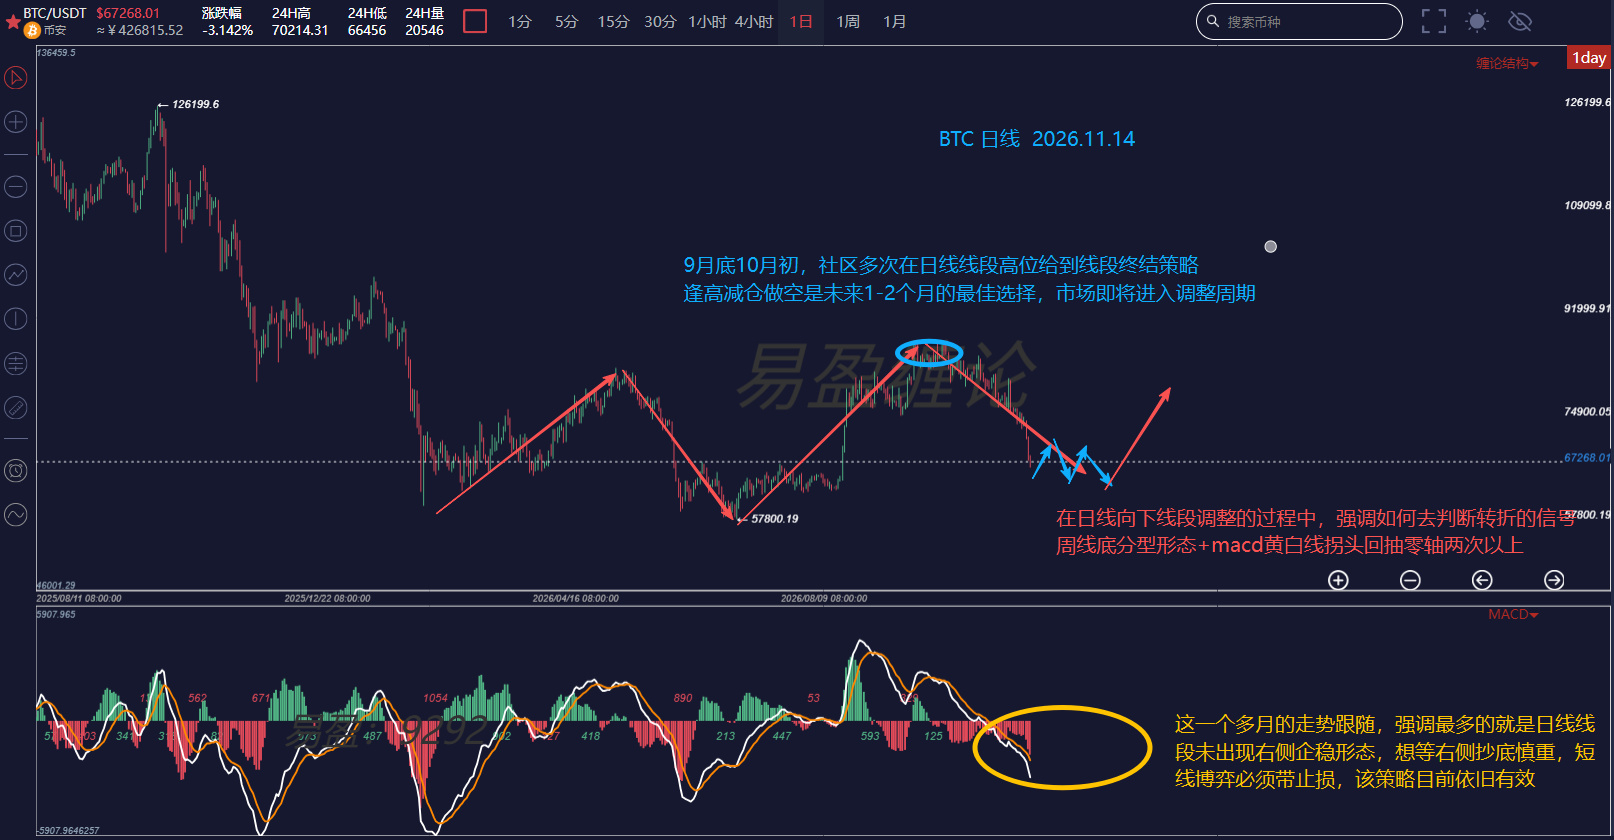
Bitcoin has fallen for six straight weeks, dropping from above $80,000 to below $70,000, then sliding to $62,000 over the weekend. It has posted six consecutive weekly losses, with the sixth week still seeing a long bearish candle. The last time the decline looked this bad was during the main leg of the 2022 bear market. The market is now filled with cries of despair and rivers of blood—but the hardest hit aren’t just retail traders. They also include the whales who firmly believed the price had “fallen far enough.”
The liquidation map is awash in the blood of long positions. Across the market, liquidations have routinely reached $900 million to $1.6 billion in 24 hours, with longs accounting for 85% to 91% of the total. BTC alone saw more than $900 million in liquidations. The long-to-short ratio is stuck at 2.67, and the crowding in long positions has barely eased. As BTC fell from $81,000 to $72,000, traders kept rushing to “buy the bottom” and add to their longs at every step down. But each time, before the rebound could gain a foothold, the next wave of selling buried them. One whale’s $493 million long position from late August, backed by $69.21 million in margin, was reduced to just $620,000—a loss of $68.59 million—before the position was ultimately wiped out. The four biggest whales lost more than $10 million each on average, and some addresses had all their SOL, BTC, and ETH long positions completely liquidated. This isn’t “shakeout”—it’s a chain of funerals for leveraged longs.
After this steep drop, the market’s various bull-market indicators have also been completely torn apart. Moving averages and Fibonacci levels have all failed. Ahr999 has fallen below 0.45, back into the “buy-the-dip zone,” and the price has already plunged below the 200-day moving average near $73,000. But MVRV, NUPL, and the Fear & Greed Index are already approaching the extreme levels seen near historical bottoms. 53% of the BTC supply is still in profit, while stablecoin liquidity continues to contract. For now, bottoming signals are beginning to emerge, but full capitulation has yet to arrive. The daily chart needs more time to stabilize and build a base, and from a Chan Theory perspective, the price structure points only to a short-term rebound—not a reversal.
$BTC
The liquidation map is awash in the blood of long positions. Across the market, liquidations have routinely reached $900 million to $1.6 billion in 24 hours, with longs accounting for 85% to 91% of the total. BTC alone saw more than $900 million in liquidations. The long-to-short ratio is stuck at 2.67, and the crowding in long positions has barely eased. As BTC fell from $81,000 to $72,000, traders kept rushing to “buy the bottom” and add to their longs at every step down. But each time, before the rebound could gain a foothold, the next wave of selling buried them. One whale’s $493 million long position from late August, backed by $69.21 million in margin, was reduced to just $620,000—a loss of $68.59 million—before the position was ultimately wiped out. The four biggest whales lost more than $10 million each on average, and some addresses had all their SOL, BTC, and ETH long positions completely liquidated. This isn’t “shakeout”—it’s a chain of funerals for leveraged longs.
After this steep drop, the market’s various bull-market indicators have also been completely torn apart. Moving averages and Fibonacci levels have all failed. Ahr999 has fallen below 0.45, back into the “buy-the-dip zone,” and the price has already plunged below the 200-day moving average near $73,000. But MVRV, NUPL, and the Fear & Greed Index are already approaching the extreme levels seen near historical bottoms. 53% of the BTC supply is still in profit, while stablecoin liquidity continues to contract. For now, bottoming signals are beginning to emerge, but full capitulation has yet to arrive. The daily chart needs more time to stabilize and build a base, and from a Chan Theory perspective, the price structure points only to a short-term rebound—not a reversal.
$BTC