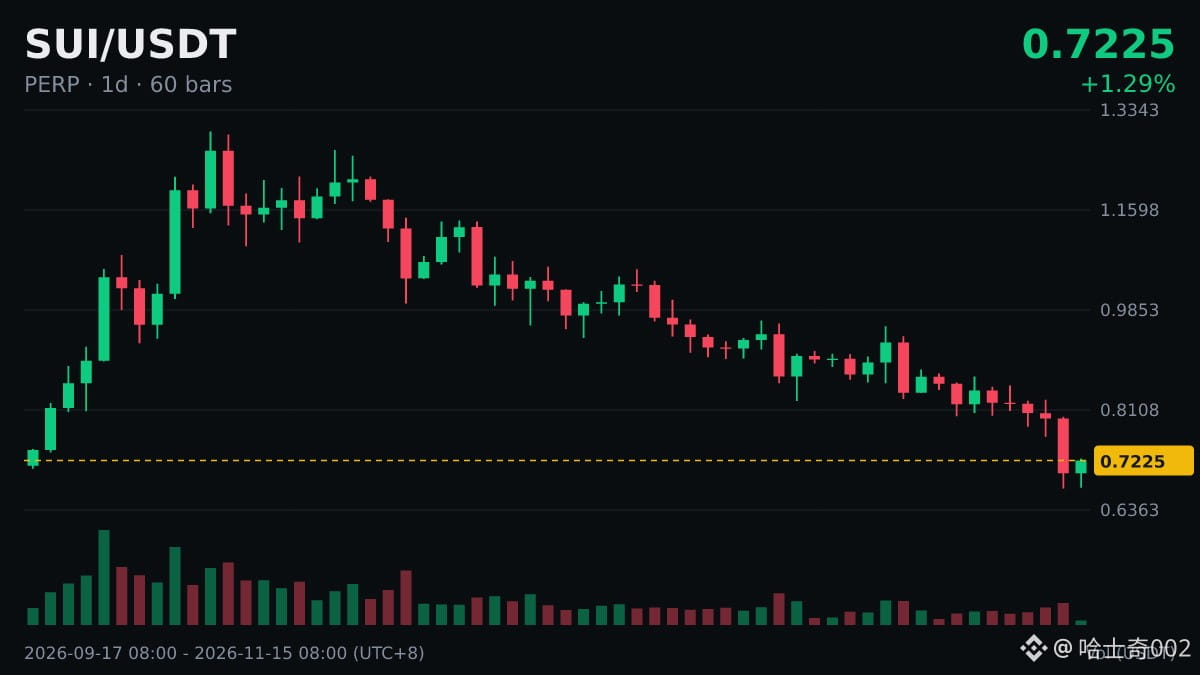
A quick note: $SUI has had 5 consecutive down days on the daily chart, with a cumulative loss of 17.09% during that period. So far today, it’s up 2.74%.
People often ask how to interpret consecutive up or down days, so here’s my take.
A streak of up or down days on the daily chart means something different from consecutive candles on the 4-hour chart: each daily candle captures the full day’s tug-of-war between buyers and sellers, so several consecutive candles of the same color are less common on the daily timeframe.
More meaningful than the number of days in a streak is whether each day’s gain or loss is getting larger or smaller. Shrinking candle bodies are often seen as a sign of weakening momentum.
Any indicator is just a summary of past price action; the market can absolutely move in the opposite direction.
People often ask how to interpret consecutive up or down days, so here’s my take.
A streak of up or down days on the daily chart means something different from consecutive candles on the 4-hour chart: each daily candle captures the full day’s tug-of-war between buyers and sellers, so several consecutive candles of the same color are less common on the daily timeframe.
More meaningful than the number of days in a streak is whether each day’s gain or loss is getting larger or smaller. Shrinking candle bodies are often seen as a sign of weakening momentum.
Any indicator is just a summary of past price action; the market can absolutely move in the opposite direction.