$VIRTUAL: When a Failed Retest Tells More Than a Clean Break
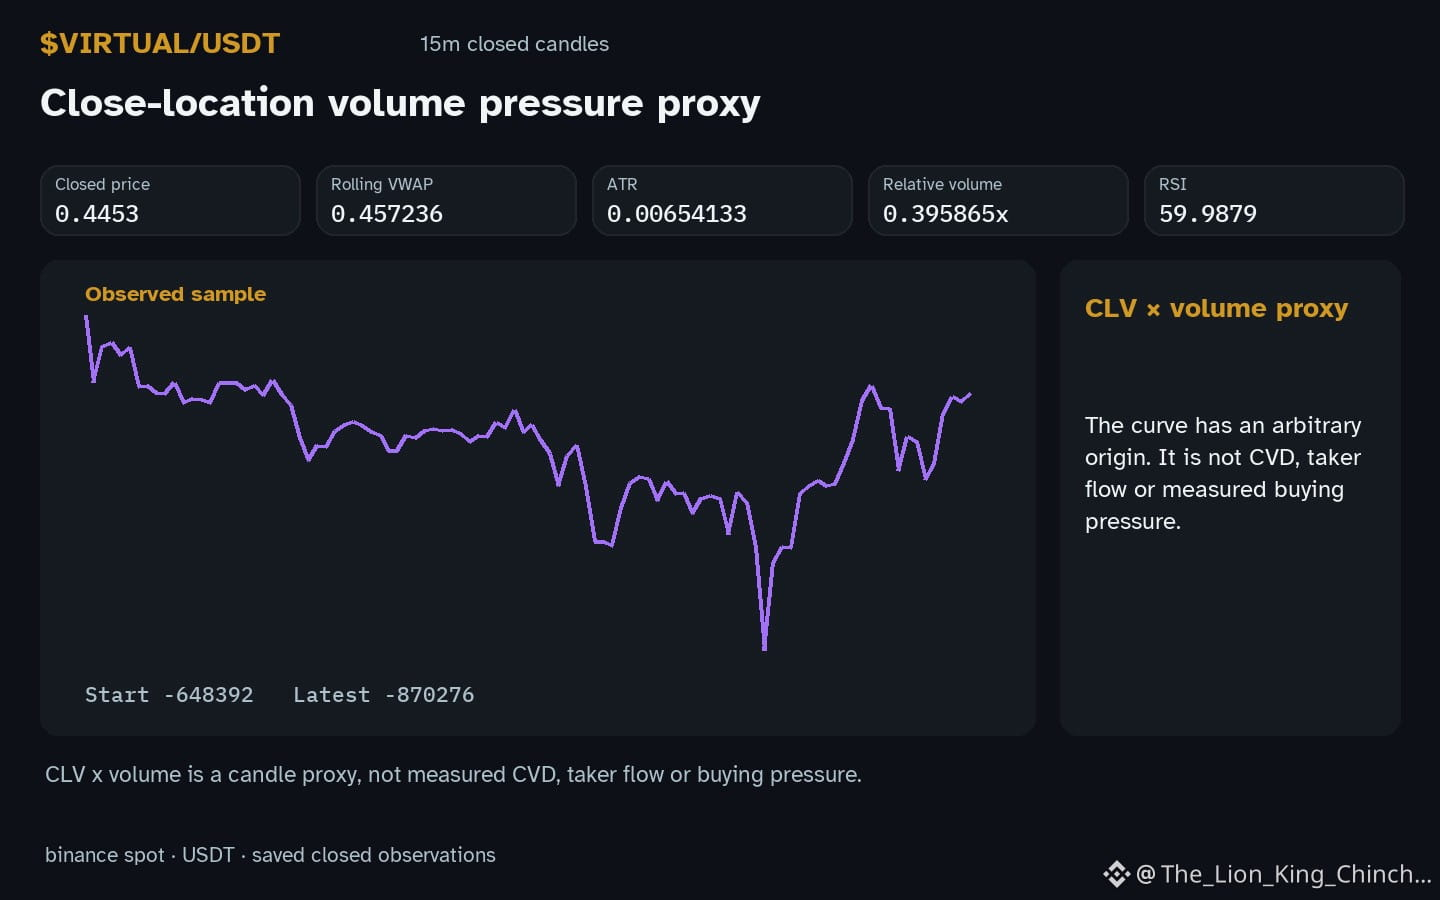
Why does $VIRTUAL move up hourly while volume stays not above baseline? A common assumption is that a strong breakout requires volume above baseline to confirm the price move.\n\n**Myth:** High volume automatically validates an upward breach of resistance.\n\n**Reality:** Volume alone does not prove that the market has committed to a new trend. In the observed candle the price sits above resistance, the direction is up, yet the relative volume display 0.40x baseline indicates only modest participation. This pattern can arise when a few trades push the price over the barrier, creating a “failed” retest that later attracts more participants. The mechanism is simple: the price test triggers stop orders or algorithmic triggers, but without sufficient new buying the volume metric stays low. Traders may interpret the move as a false breakout, but the retest itself provides diagnostic information – it shows where stop clusters sit and whether liquidity was absorbed.\n\n**Counterexample:** If the next hourly candle closes below resistance with a similar low volume, the initial upward move is likely a fleeting spike rather than a trend shift. Conversely, a sustained rise with rising relative volume would weaken the “failed” interpretation.\n\n**Reassessment condition:** Watch for the relative volume display to exceed the baseline in the following closed candle while the price remains above resistance. An increase would suggest genuine buying pressure, whereas continued low volume would reinforce the notion of a temporary breach.
Probabilistic market research, not a recommendation or guaranteed return.
#VIRTUAL #CryptoLearning
Why does $VIRTUAL move up hourly while volume stays not above baseline? A common assumption is that a strong breakout requires volume above baseline to confirm the price move.\n\n**Myth:** High volume automatically validates an upward breach of resistance.\n\n**Reality:** Volume alone does not prove that the market has committed to a new trend. In the observed candle the price sits above resistance, the direction is up, yet the relative volume display 0.40x baseline indicates only modest participation. This pattern can arise when a few trades push the price over the barrier, creating a “failed” retest that later attracts more participants. The mechanism is simple: the price test triggers stop orders or algorithmic triggers, but without sufficient new buying the volume metric stays low. Traders may interpret the move as a false breakout, but the retest itself provides diagnostic information – it shows where stop clusters sit and whether liquidity was absorbed.\n\n**Counterexample:** If the next hourly candle closes below resistance with a similar low volume, the initial upward move is likely a fleeting spike rather than a trend shift. Conversely, a sustained rise with rising relative volume would weaken the “failed” interpretation.\n\n**Reassessment condition:** Watch for the relative volume display to exceed the baseline in the following closed candle while the price remains above resistance. An increase would suggest genuine buying pressure, whereas continued low volume would reinforce the notion of a temporary breach.
Probabilistic market research, not a recommendation or guaranteed return.
#VIRTUAL #CryptoLearning