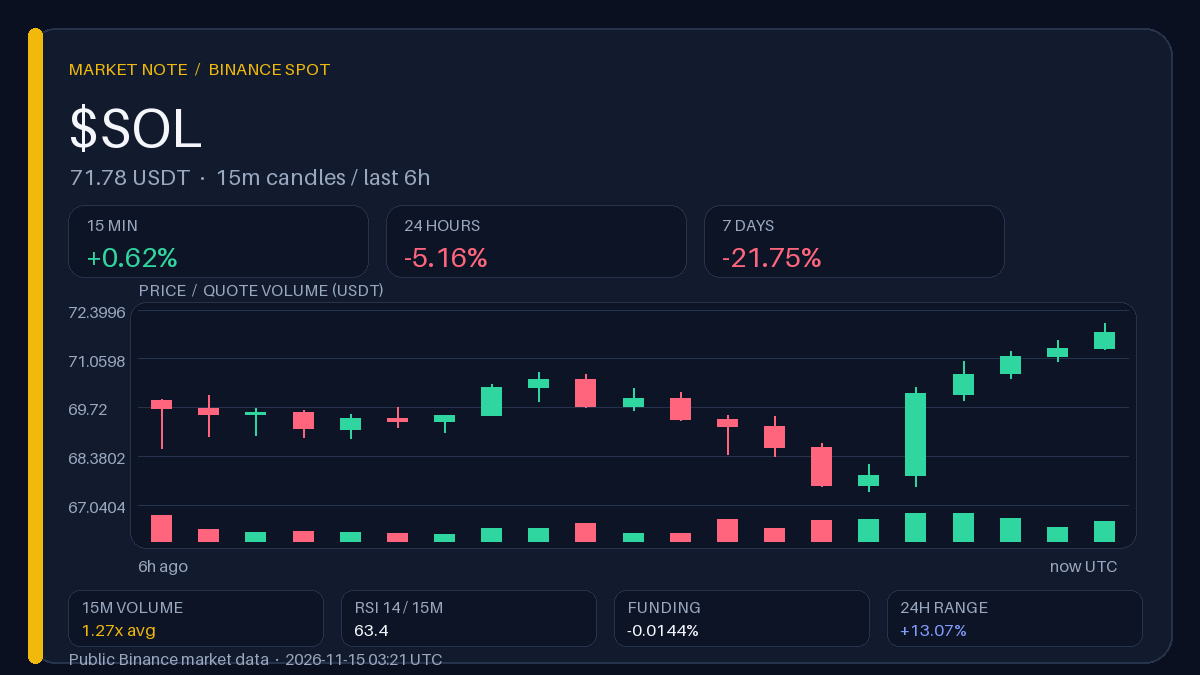
$SOL At the upper edge of the bounce with negative funding
A brief gain on the 15-minute chart looks like a bounce within a weekly decline, not a change in direction. Funding at −0.0144% shows that some positions are held against the rise; this is positioning, not a forecast, and volume at ×1.27 does not confirm it yet.
Observation range · 5 h
Above 72.0300: Holding above the upper edge of the local range with negative funding would strengthen the case that short positions are overcrowded.
Below 67.4100: A return to the lower edge would shift the interpretation back to a pullback within the weekly decline, rather than a reversal.
Levels are historical; a single wick does not confirm the scenario.
↩️ Recap of the previous “Contrast Radar” edition (13.11 06:25 UTC): SOL 78.8700 → 80.1600 USDT (+1.64% in 12 h), funding +0.001% → +0.010%.
What would need to change in funding for the bounce to become more than just a technical one?
Binance data, snapshot at 03:21 UTC. The author may receive rewards through Binance Square Write to Earn.
A brief gain on the 15-minute chart looks like a bounce within a weekly decline, not a change in direction. Funding at −0.0144% shows that some positions are held against the rise; this is positioning, not a forecast, and volume at ×1.27 does not confirm it yet.
Observation range · 5 h
Above 72.0300: Holding above the upper edge of the local range with negative funding would strengthen the case that short positions are overcrowded.
Below 67.4100: A return to the lower edge would shift the interpretation back to a pullback within the weekly decline, rather than a reversal.
Levels are historical; a single wick does not confirm the scenario.
↩️ Recap of the previous “Contrast Radar” edition (13.11 06:25 UTC): SOL 78.8700 → 80.1600 USDT (+1.64% in 12 h), funding +0.001% → +0.010%.
What would need to change in funding for the bounce to become more than just a technical one?
Binance data, snapshot at 03:21 UTC. The author may receive rewards through Binance Square Write to Earn.