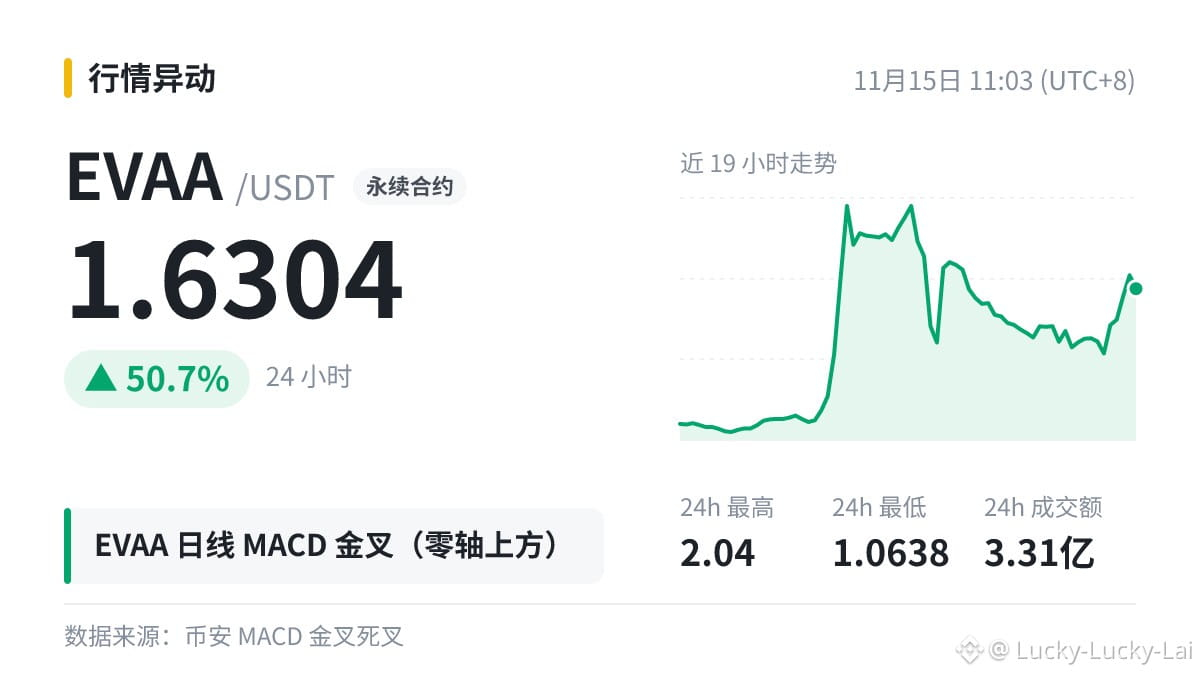
Technical Note|$EVAA |Daily MACD|Bullish Crossover Above the Zero Line
Definition: The MACD histogram is the difference between DIF and DEA. Some charting software multiplies it by 2. When the histogram turns from negative to positive, DIF crosses above DEA.
A note on interpretation: A death cross above the zero line is often seen as a sign that upward momentum is slowing, but it doesn't necessarily mean the trend has reversed. A death cross below the zero line is often seen as a continuation of weakness.
With leveraged trading, first consider whether you can withstand the worst-case outcome, then consider what the indicator is telling you.
Volatility is significant; manage your leverage carefully.
Definition: The MACD histogram is the difference between DIF and DEA. Some charting software multiplies it by 2. When the histogram turns from negative to positive, DIF crosses above DEA.
A note on interpretation: A death cross above the zero line is often seen as a sign that upward momentum is slowing, but it doesn't necessarily mean the trend has reversed. A death cross below the zero line is often seen as a continuation of weakness.
With leveraged trading, first consider whether you can withstand the worst-case outcome, then consider what the indicator is telling you.
Volatility is significant; manage your leverage carefully.