Brother Monkey: Stop hunting for macro data everywhere! Build a Wall Street-grade data dashboard with Muse.
When investing, the biggest problem isn’t a lack of data—it’s that the data is scattered everywhere.
CPI, PCE, nonfarm payrolls, unemployment, GDP, ISM PMI, JOLTS…
Whenever important data is released, you have to keep switching between different websites.
This time, Brother Monkey used #Muse to build a macro data hub, bringing all these market-moving indicators together on one page.
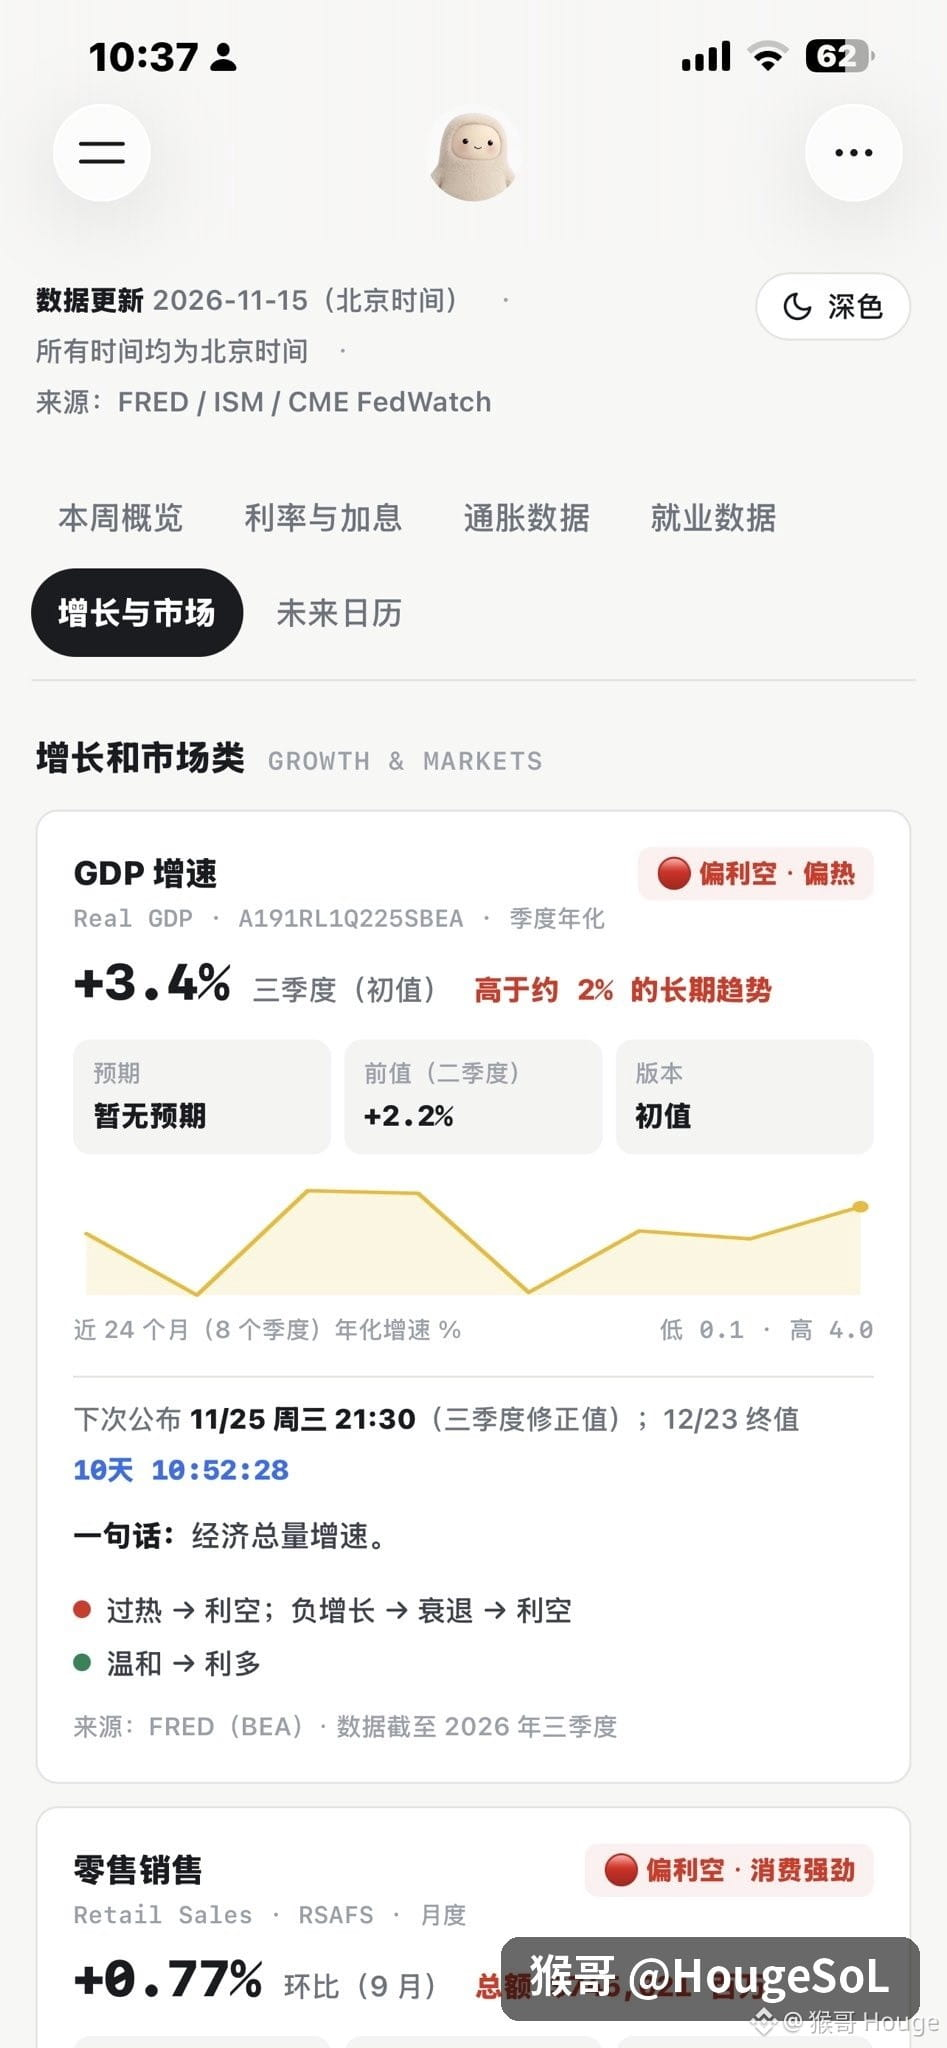
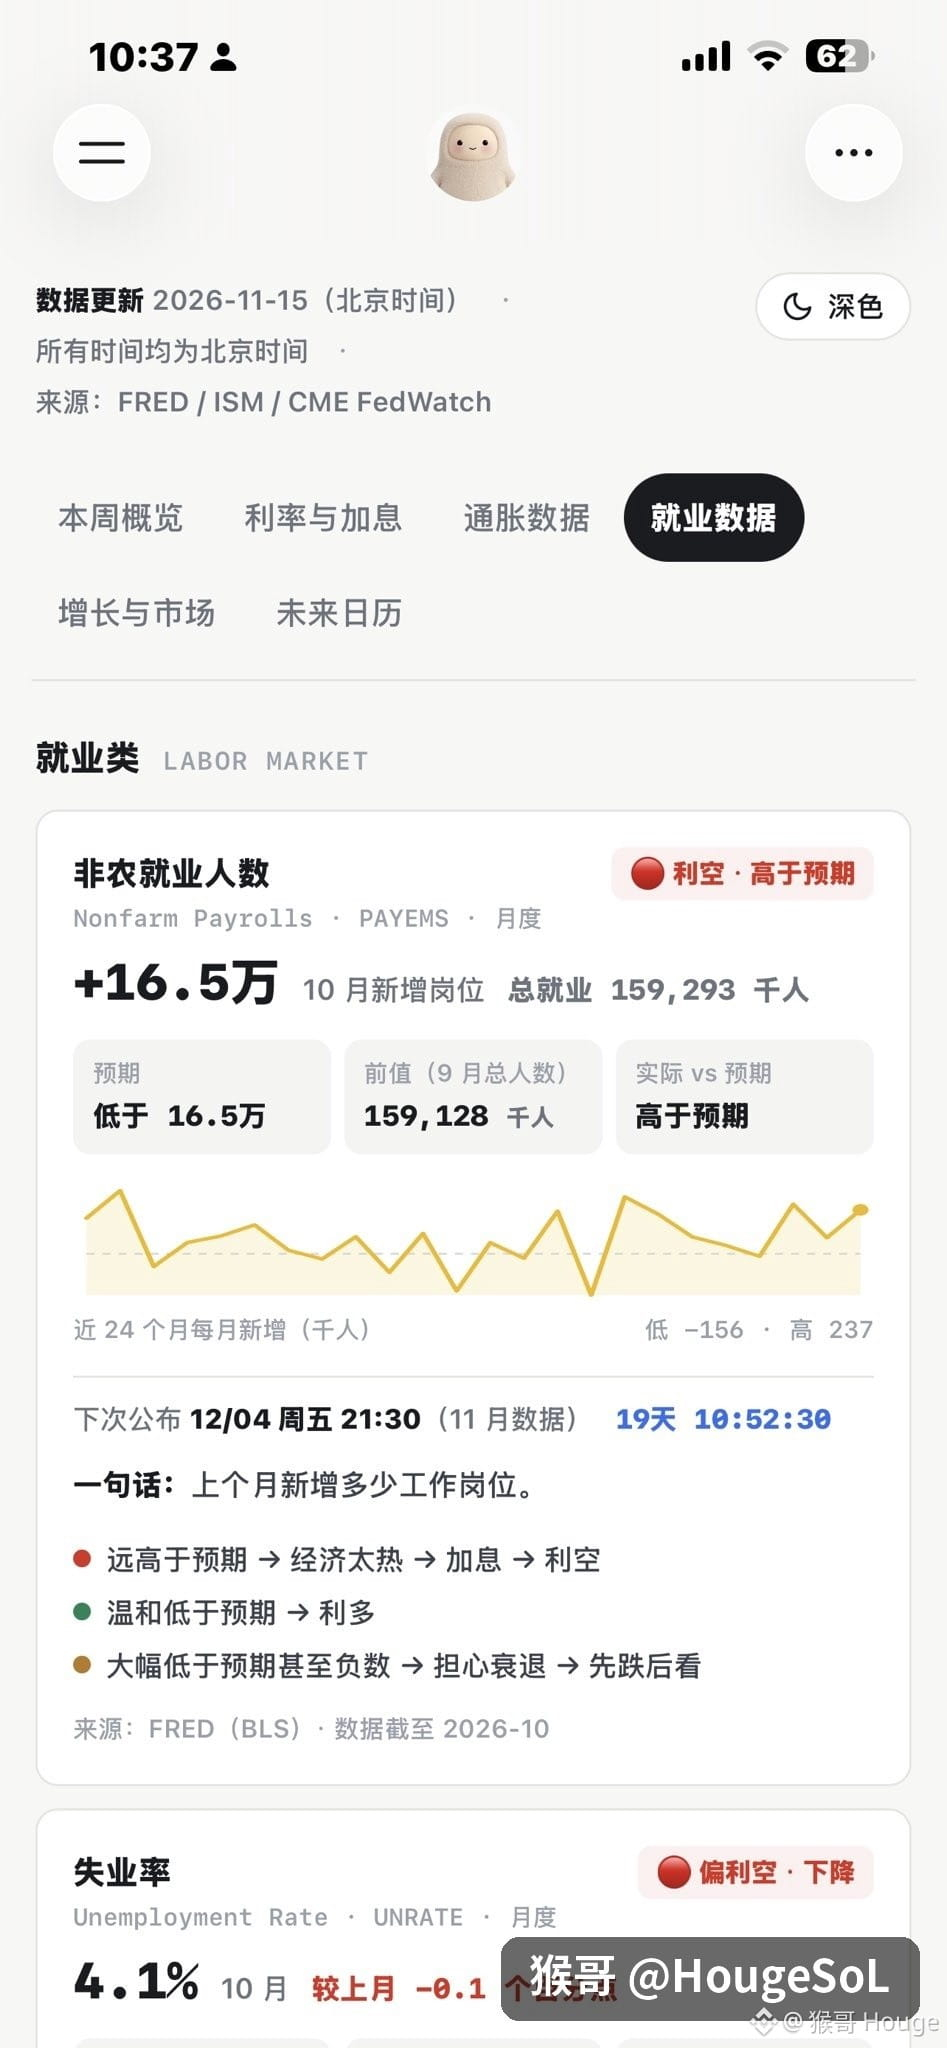
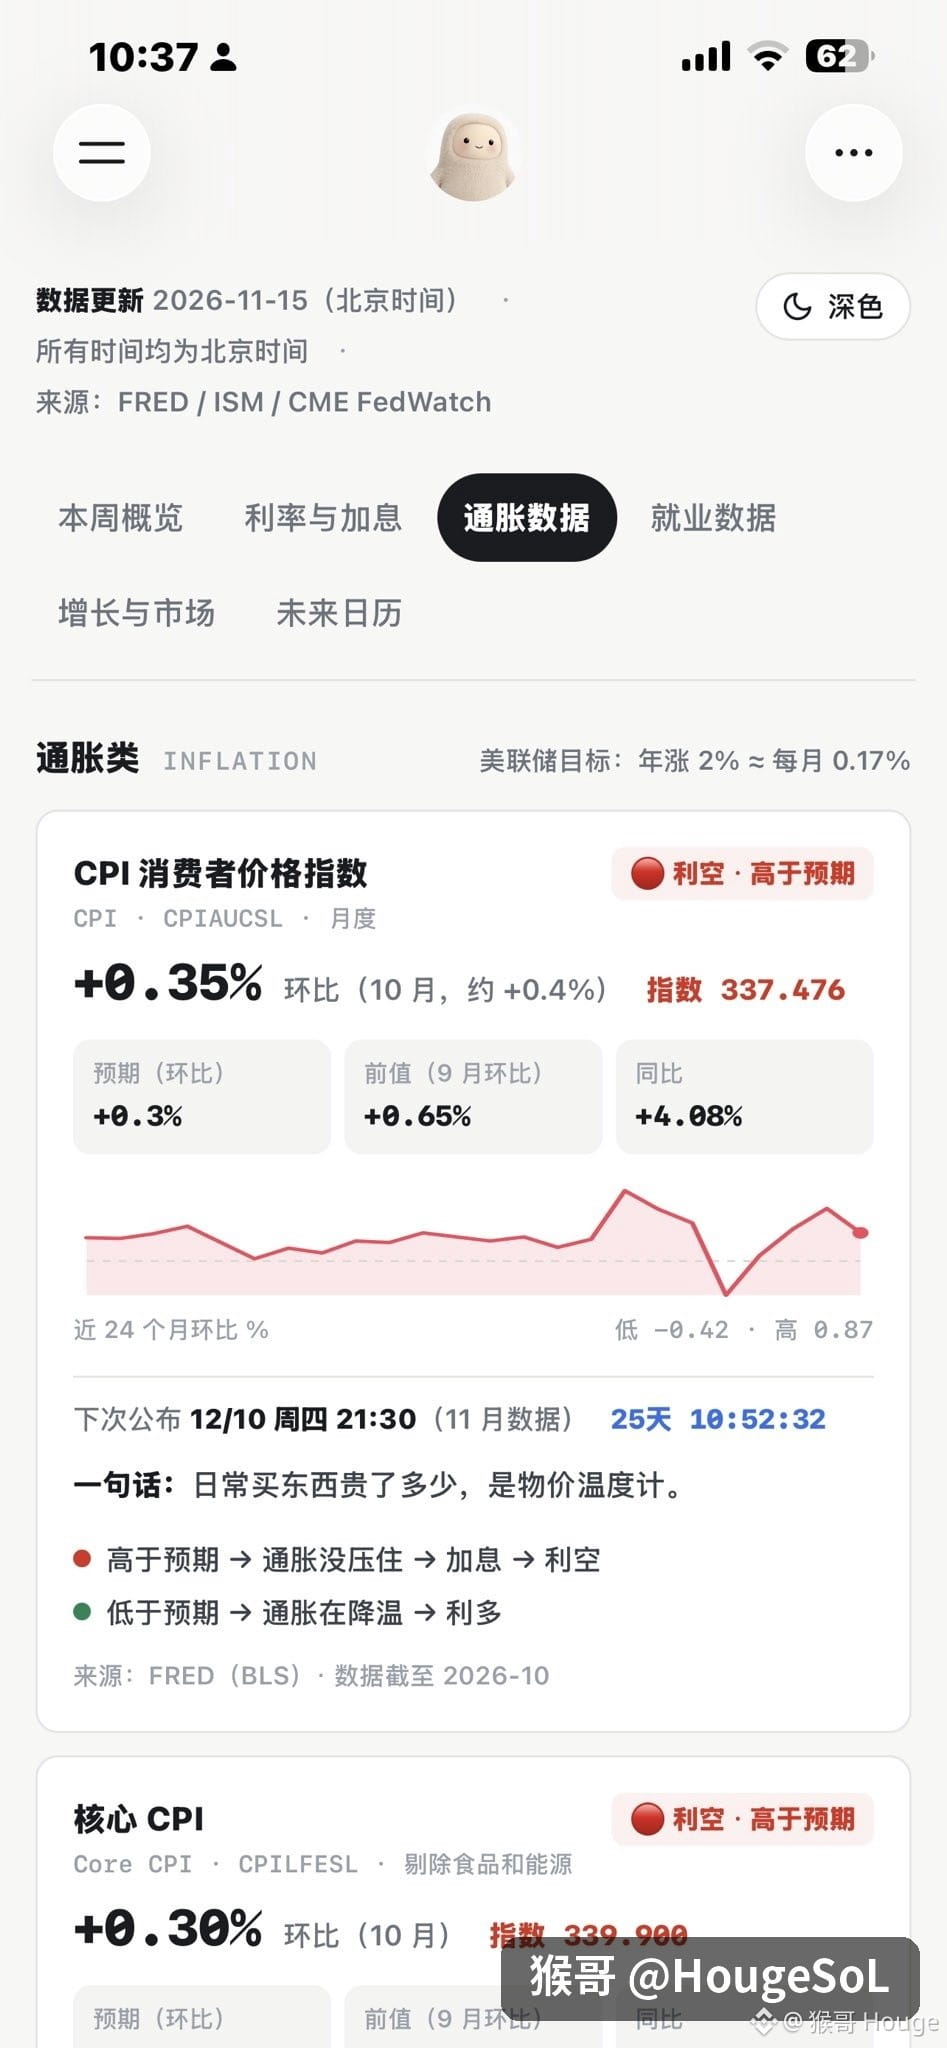
You can view inflation, employment, economic growth, manufacturing and services activity, Federal Reserve interest rates, Treasury yields, and proxy indicators for the U.S. dollar index—all in one place.
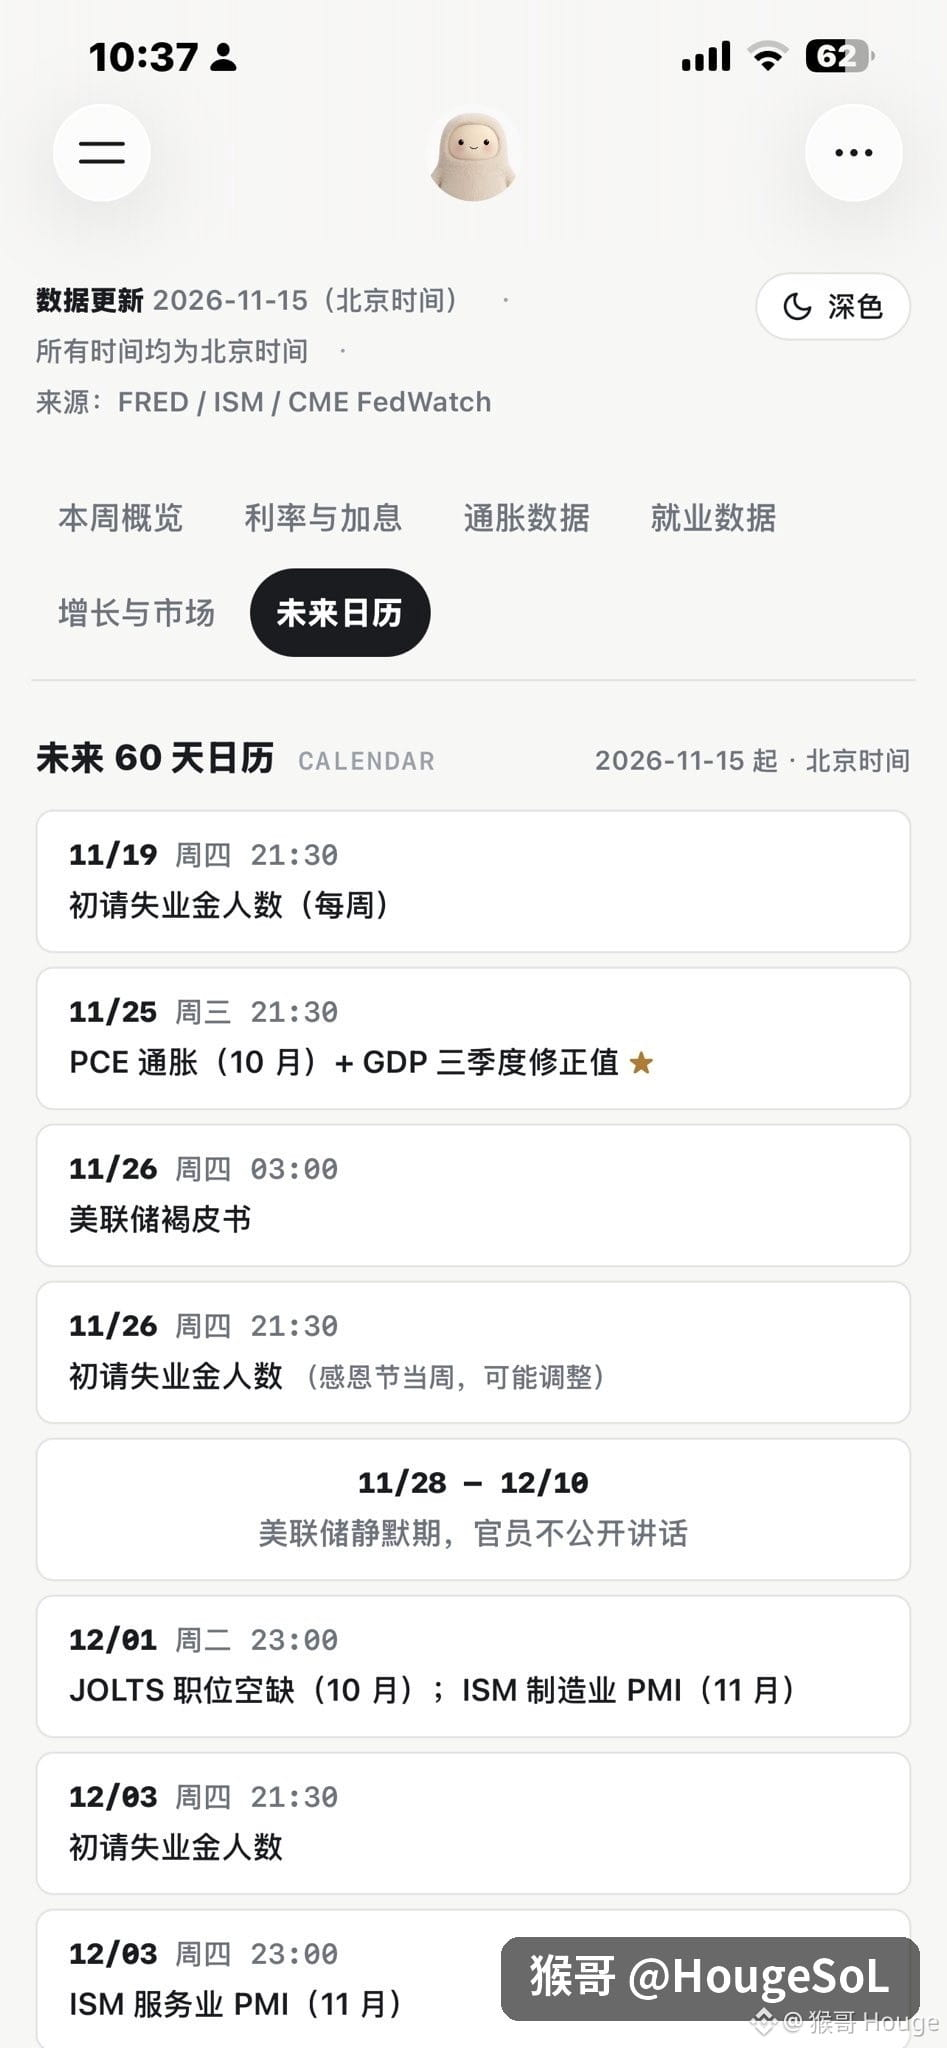
You can do more than just check the latest figures: you can also see historical trends over the past 24 months, data changes, the next release date, and a calendar of major economic events.
From the FRED data API, indicator codes, and initial data to the page layout and automatic updates, Brother Monkey has organized everything into one complete prompt.
The real value of this data isn’t predicting whether prices will rise or fall tomorrow—it’s helping you understand the macro cycle and the flow of capital.
When the market might enter an easing cycle, when liquidity starts to improve, and when it’s worth paying close attention to potential bottoming opportunities in assets like BTC, QQQ, SMH, and SOXX.
Understanding the big-picture trends matters far more than staring at a few candlesticks every day.
The complete prompt is in the comments. Save it for later—you may find it useful in the next market cycle.
When investing, the biggest problem isn’t a lack of data—it’s that the data is scattered everywhere.
CPI, PCE, nonfarm payrolls, unemployment, GDP, ISM PMI, JOLTS…
Whenever important data is released, you have to keep switching between different websites.
This time, Brother Monkey used #Muse to build a macro data hub, bringing all these market-moving indicators together on one page.
You can view inflation, employment, economic growth, manufacturing and services activity, Federal Reserve interest rates, Treasury yields, and proxy indicators for the U.S. dollar index—all in one place.
You can do more than just check the latest figures: you can also see historical trends over the past 24 months, data changes, the next release date, and a calendar of major economic events.
From the FRED data API, indicator codes, and initial data to the page layout and automatic updates, Brother Monkey has organized everything into one complete prompt.
The real value of this data isn’t predicting whether prices will rise or fall tomorrow—it’s helping you understand the macro cycle and the flow of capital.
When the market might enter an easing cycle, when liquidity starts to improve, and when it’s worth paying close attention to potential bottoming opportunities in assets like BTC, QQQ, SMH, and SOXX.
Understanding the big-picture trends matters far more than staring at a few candlesticks every day.
The complete prompt is in the comments. Save it for later—you may find it useful in the next market cycle.