The bounce is here, but I’m not planning to chase longs—let’s get the numbers out first, then make a judgment.
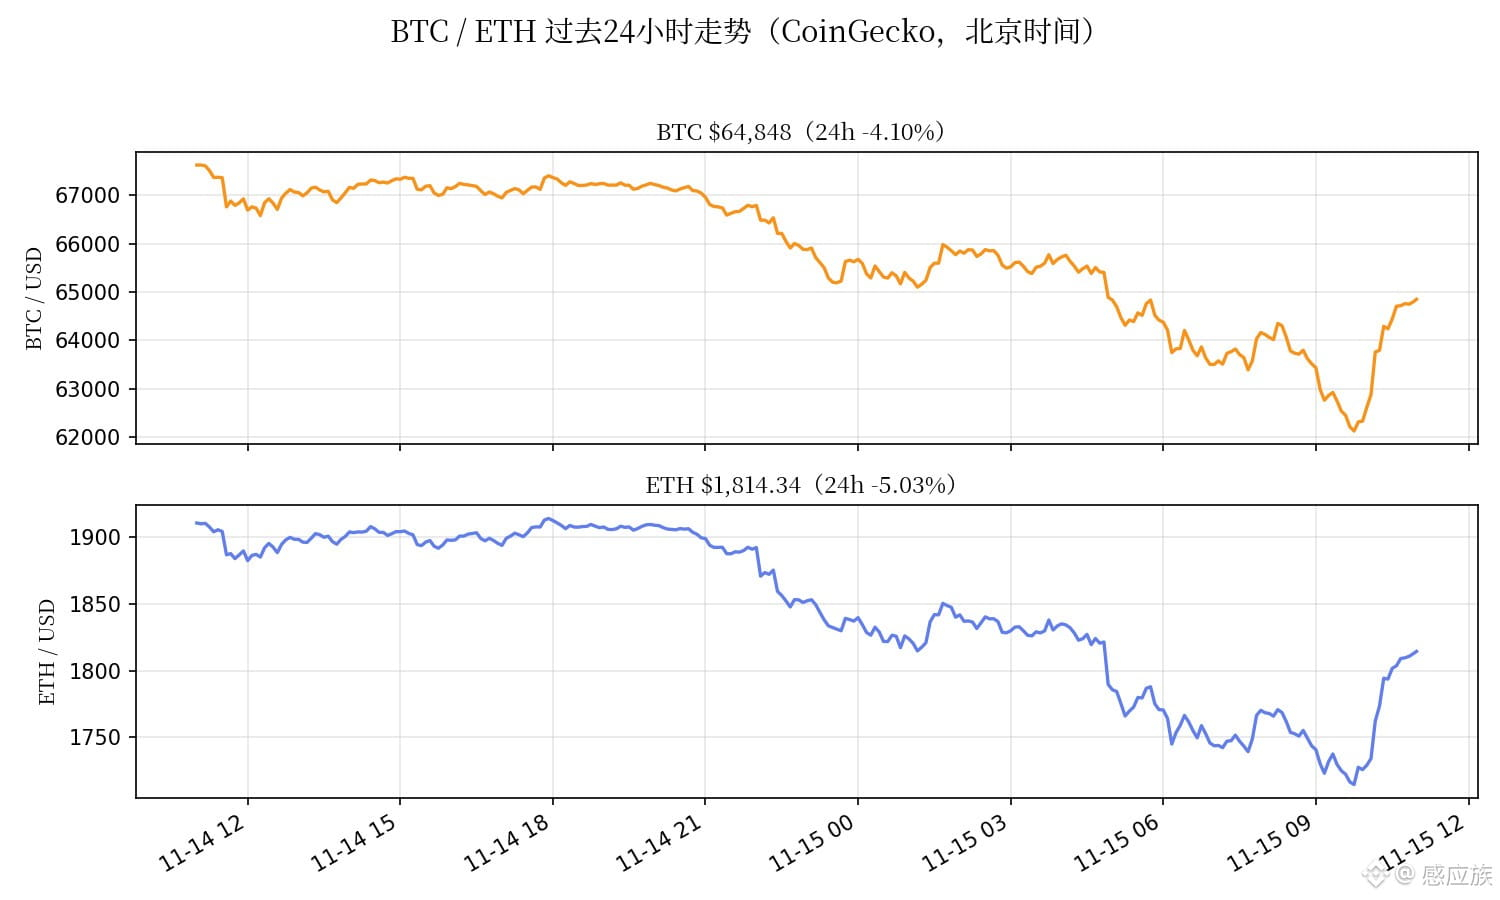
11:00: $BTC , about $64,769, down 4.2% over 24 hours; $ETH , about $1,811, down 5.1% over 24 hours (CoinGecko, prices checked at 11:00 Beijing time). Compared with around 09:00 (BTC $63,425, ETH $1,740), BTC has bounced about 2.1% and ETH about 4.1%. From their overnight lows, BTC bottomed at around $63,311—a three-month low—and ETH at around $1,731, its lowest since July 9. They’re now up about 2.3% and 4.7% from their respective lows.
How should we read this bounce? My take: an oversold rebound, not a reversal. The 4-hour RSI briefly fell to around 17 yesterday—deeply oversold—so after such a steep drop, a technical bounce is only natural. But the structure hasn’t changed: price is still below the 200-week moving average, around $68,000. If the 12:00 4-hour candle also closes below $68,000, that’ll make seven consecutive candles. The weekly close at 08:00 Monday is the final verdict. First, watch $65,000—the level my first target just broke through, which has now become the first resistance. If price can’t reclaim it, this bounce is a bull trap. Above that, the next levels are $67,000 and $68,000.
Liquidation data also supports the interpretation that this was “forced selling, not active dumping”: around $1.9 billion in total crypto liquidations over 24 hours (CoinGlass data, via The Straits Times), the vast majority of them longs. Analyst Ted Pillows said that in the hour BTC fell below $66,000, around $200 million in positions were liquidated, almost all longs—this was leveraged positions being forcibly closed, not large holders selling off (CryptoPotato). ETFs are doing the same old thing: net outflows for a seventh straight day, totaling about $1.91 billion since November 5 (SoSoValue). The probability of a 25-basis-point rate hike in December is 88.5% (CME FedWatch), and the 10-year U.S. Treasury yield is 5.15%—the macro winds are still blowing in the bears’ favor.
Short position tracker #9: Opened a short at $68,000–$69,000 on November 14 at 13:00, with a midpoint entry of $68,500. Current price: $64,769, down 5.45%. At 100x leverage, the remaining half has an unrealized gain of about +545% on margin. Around 09:00 it was +741%; to be honest, the unrealized gain has shrunk by nearly 200 percentage points, and the bounce has eaten into some of my profit. Half of target one at $65,000 was closed overnight for about +511%. The stop-loss above $70,500 and the invalidation level—a 4-hour close above $70,214—haven’t been hit, so I’m holding. Target two remains $62,300–$62,800; the current price is still about $1,970 from the upper end of that range.
No change to the plan: keep holding the short, with target two at $62,300–$62,800; close as planned if it gets there, and don’t get greedy. I won’t chase longs or add to the position on this bounce (the rule against chasing shorts below $68,000 still stands). If price bounces into the $65,000–$67,000 area but can’t close above it on the 4-hour chart, the structure remains bearish. If a 4-hour candle closes above $70,214, I’ll admit I’m wrong and exit. With 100x leverage, I’m only putting a very small portion of my total funds at risk as margin.
The trending coins are all in the red: PUMP down 13.4% in a day, UNI down 10.8%, ADA down 9.5%, and PEPE down 8.8%. No new small-cap coins have made the list. The whole market is losing steam—just a sentiment gauge, not something I’m touching.
Do you think this bounce can reach $65,000? Let’s talk in the comments. (Prices: CoinGecko, checked at 11:00 Beijing time on November 15; chart shows the past 24 hours.)
11:00: $BTC , about $64,769, down 4.2% over 24 hours; $ETH , about $1,811, down 5.1% over 24 hours (CoinGecko, prices checked at 11:00 Beijing time). Compared with around 09:00 (BTC $63,425, ETH $1,740), BTC has bounced about 2.1% and ETH about 4.1%. From their overnight lows, BTC bottomed at around $63,311—a three-month low—and ETH at around $1,731, its lowest since July 9. They’re now up about 2.3% and 4.7% from their respective lows.
How should we read this bounce? My take: an oversold rebound, not a reversal. The 4-hour RSI briefly fell to around 17 yesterday—deeply oversold—so after such a steep drop, a technical bounce is only natural. But the structure hasn’t changed: price is still below the 200-week moving average, around $68,000. If the 12:00 4-hour candle also closes below $68,000, that’ll make seven consecutive candles. The weekly close at 08:00 Monday is the final verdict. First, watch $65,000—the level my first target just broke through, which has now become the first resistance. If price can’t reclaim it, this bounce is a bull trap. Above that, the next levels are $67,000 and $68,000.
Liquidation data also supports the interpretation that this was “forced selling, not active dumping”: around $1.9 billion in total crypto liquidations over 24 hours (CoinGlass data, via The Straits Times), the vast majority of them longs. Analyst Ted Pillows said that in the hour BTC fell below $66,000, around $200 million in positions were liquidated, almost all longs—this was leveraged positions being forcibly closed, not large holders selling off (CryptoPotato). ETFs are doing the same old thing: net outflows for a seventh straight day, totaling about $1.91 billion since November 5 (SoSoValue). The probability of a 25-basis-point rate hike in December is 88.5% (CME FedWatch), and the 10-year U.S. Treasury yield is 5.15%—the macro winds are still blowing in the bears’ favor.
Short position tracker #9: Opened a short at $68,000–$69,000 on November 14 at 13:00, with a midpoint entry of $68,500. Current price: $64,769, down 5.45%. At 100x leverage, the remaining half has an unrealized gain of about +545% on margin. Around 09:00 it was +741%; to be honest, the unrealized gain has shrunk by nearly 200 percentage points, and the bounce has eaten into some of my profit. Half of target one at $65,000 was closed overnight for about +511%. The stop-loss above $70,500 and the invalidation level—a 4-hour close above $70,214—haven’t been hit, so I’m holding. Target two remains $62,300–$62,800; the current price is still about $1,970 from the upper end of that range.
No change to the plan: keep holding the short, with target two at $62,300–$62,800; close as planned if it gets there, and don’t get greedy. I won’t chase longs or add to the position on this bounce (the rule against chasing shorts below $68,000 still stands). If price bounces into the $65,000–$67,000 area but can’t close above it on the 4-hour chart, the structure remains bearish. If a 4-hour candle closes above $70,214, I’ll admit I’m wrong and exit. With 100x leverage, I’m only putting a very small portion of my total funds at risk as margin.
The trending coins are all in the red: PUMP down 13.4% in a day, UNI down 10.8%, ADA down 9.5%, and PEPE down 8.8%. No new small-cap coins have made the list. The whole market is losing steam—just a sentiment gauge, not something I’m touching.
Do you think this bounce can reach $65,000? Let’s talk in the comments. (Prices: CoinGecko, checked at 11:00 Beijing time on November 15; chart shows the past 24 hours.)