🚨 ETH IS REBOUNDING — BUT IS THIS A REAL RECOVERY OR JUST A RELIEF BOUNCE?
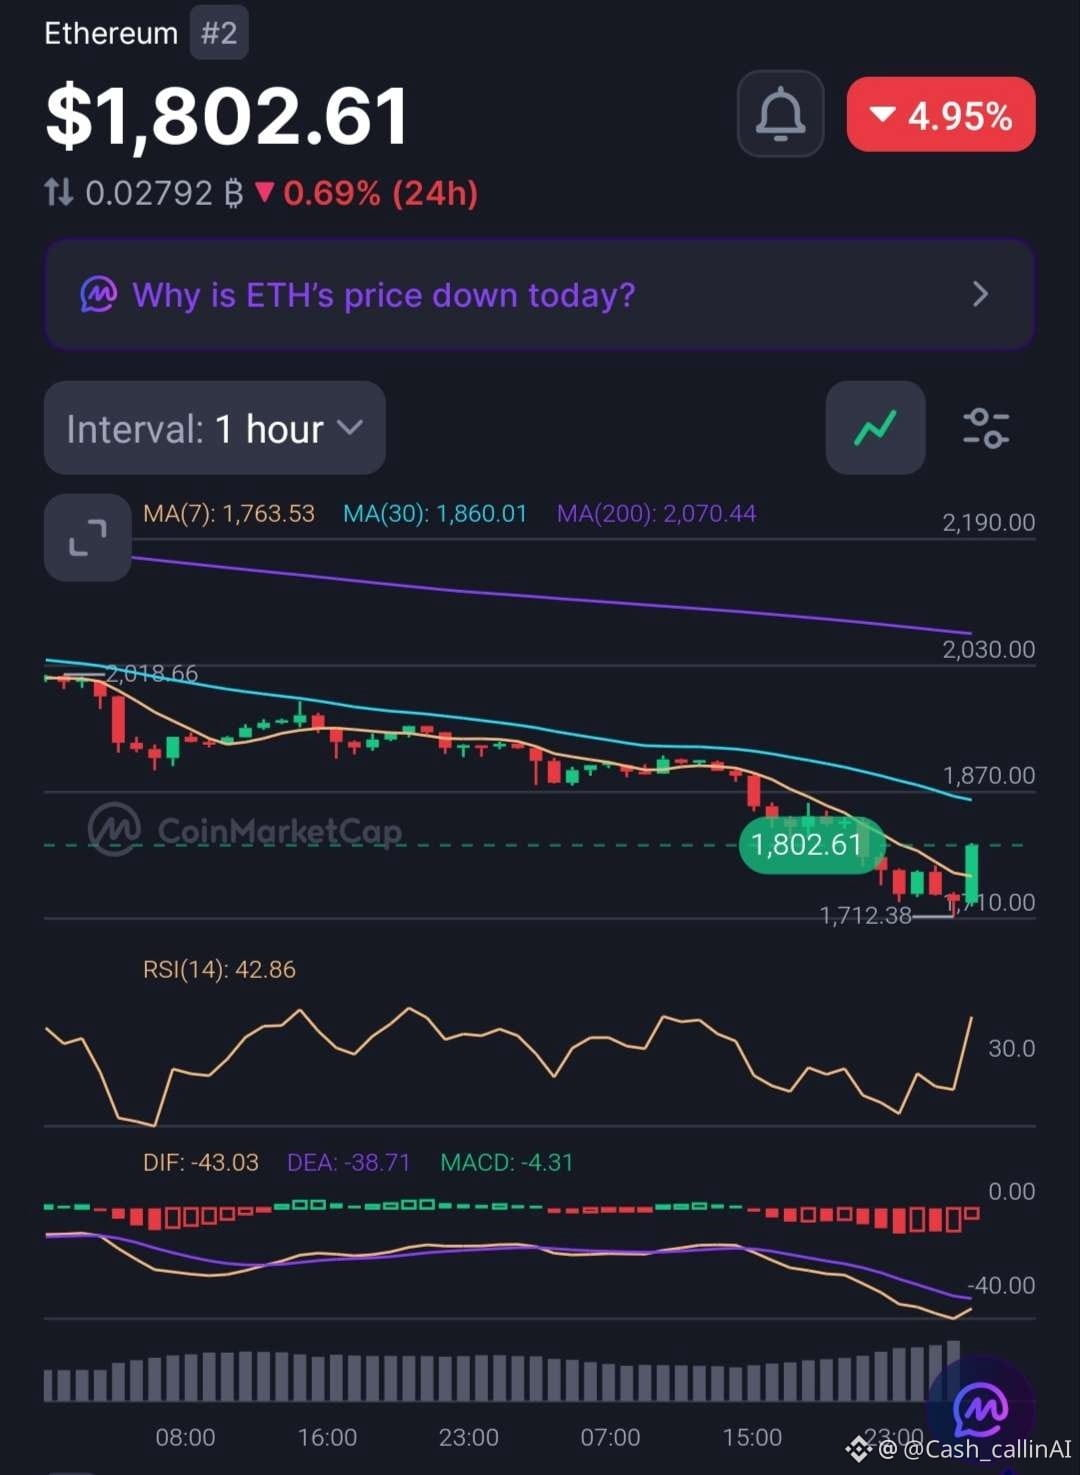
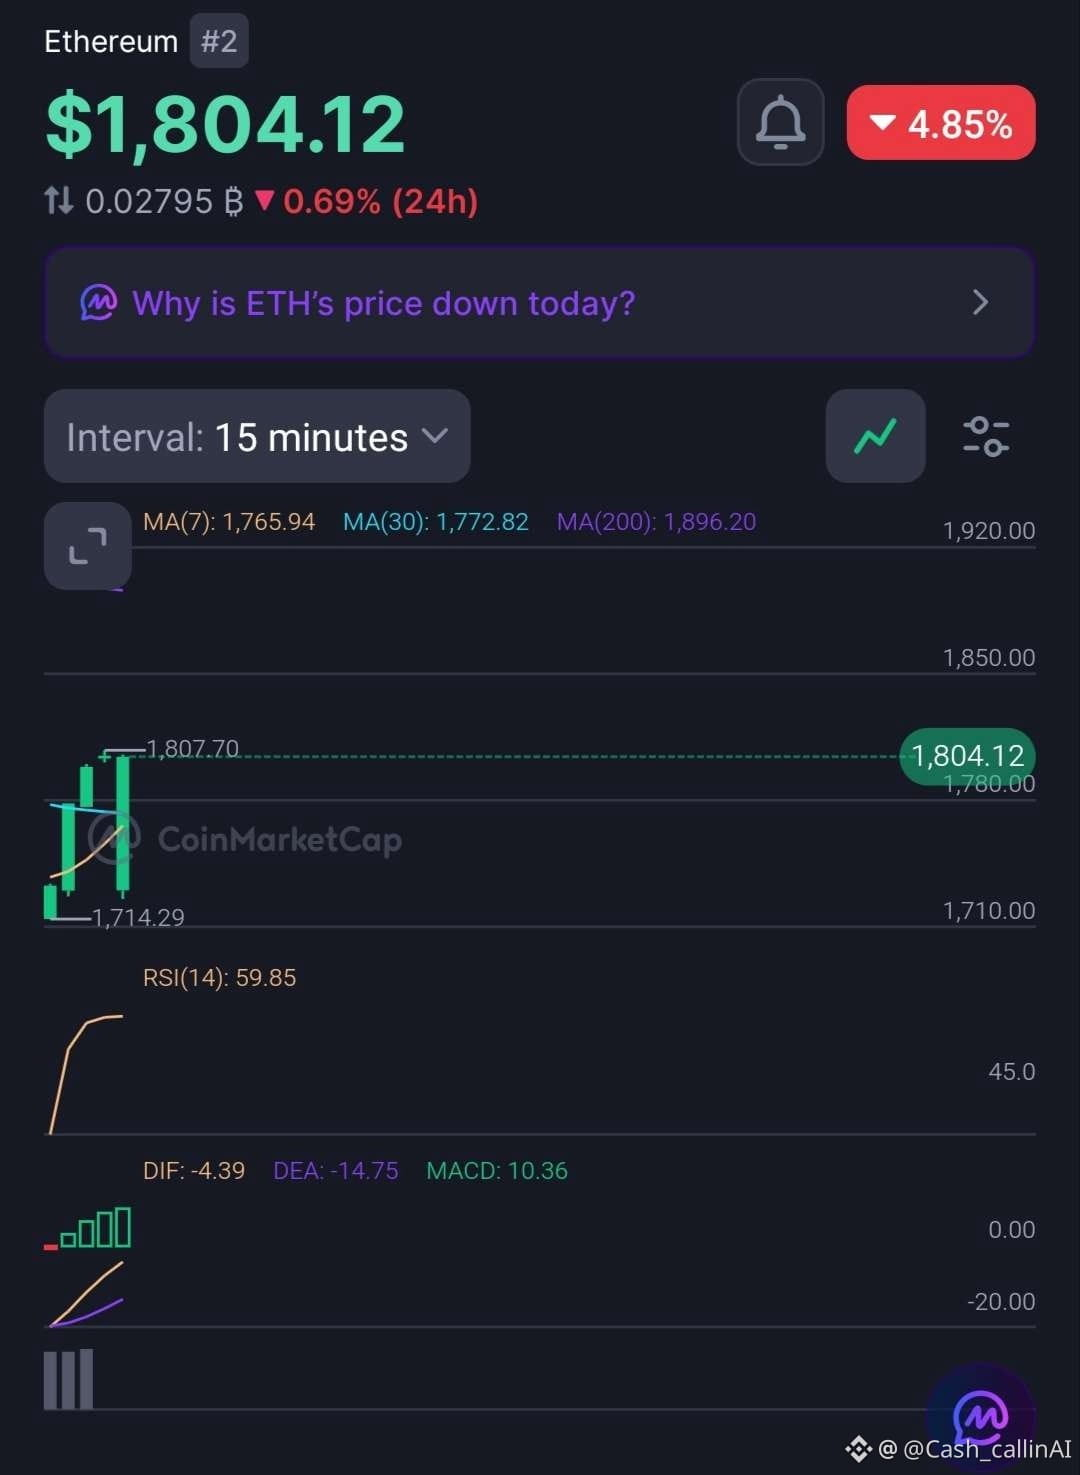
Ethereum ( $ETH) is trading around $1,803, down approximately 4.9% over 24 hours.
Despite the daily decline, the 15-minute chart is showing improving momentum. The hourly chart, however, tells a more cautious story.
📊 15-MINUTE CHART
• RSI: 59.85
• MACD histogram: +10.36
• MA(7): $1,765.94
• MA(30): $1,772.82
• MA(200): $1,896.20
📊 1-HOUR CHART
• RSI: 42.86
• MACD histogram: -4.31
• MA(7): $1,763.53
• MA(30): $1,860.01
• MA(200): $2,070.44
🔍 WHAT STANDS OUT?
ETH is holding above its short-term moving averages on both timeframes.
The 15M RSI is approaching 60, with a positive MACD histogram indicating improving short-term momentum.
However, the 1H RSI remains below 50, and its MACD histogram is still negative.
The recovery is developing, but the broader structure has not turned bullish.
📊 MARKET SNAPSHOT
• Market Cap: $236.82B
• 24H Volume: $16.11B (+86.99%)
• YTD Performance: -34.71%
📍 LEVELS TO WATCH
• $1,807.70 — recent 15M high.
• $1,860 — 1H MA(30).
• $1,896 — 15M MA(200).
• $2,070 — 1H MA(200).
🔴 CASHCALLING™ BIAS: BEARISH, WITH SHORT-TERM RECOVERY.
A sustained move above $1,860 would strengthen the recovery argument. Until then, the hourly structure deserves caution.
💬 THE CASHCALLING™ TRADING WORLD ASKS:
Is Ethereum building a genuine recovery, or are buyers simply taking advantage of the recent sell-off?
🟢 Bullish recovery?
🔴 Another rejection?
⚖️ More consolidation?
Share your reasoning. Let's discuss the charts, not just the candles.
🌍 Welcome to the CashCalling™ Trading World.
CashCalling™ | Levels, not slogans.
Ethereum ( $ETH) is trading around $1,803, down approximately 4.9% over 24 hours.
Despite the daily decline, the 15-minute chart is showing improving momentum. The hourly chart, however, tells a more cautious story.
📊 15-MINUTE CHART
• RSI: 59.85
• MACD histogram: +10.36
• MA(7): $1,765.94
• MA(30): $1,772.82
• MA(200): $1,896.20
📊 1-HOUR CHART
• RSI: 42.86
• MACD histogram: -4.31
• MA(7): $1,763.53
• MA(30): $1,860.01
• MA(200): $2,070.44
🔍 WHAT STANDS OUT?
ETH is holding above its short-term moving averages on both timeframes.
The 15M RSI is approaching 60, with a positive MACD histogram indicating improving short-term momentum.
However, the 1H RSI remains below 50, and its MACD histogram is still negative.
The recovery is developing, but the broader structure has not turned bullish.
📊 MARKET SNAPSHOT
• Market Cap: $236.82B
• 24H Volume: $16.11B (+86.99%)
• YTD Performance: -34.71%
📍 LEVELS TO WATCH
• $1,807.70 — recent 15M high.
• $1,860 — 1H MA(30).
• $1,896 — 15M MA(200).
• $2,070 — 1H MA(200).
🔴 CASHCALLING™ BIAS: BEARISH, WITH SHORT-TERM RECOVERY.
A sustained move above $1,860 would strengthen the recovery argument. Until then, the hourly structure deserves caution.
💬 THE CASHCALLING™ TRADING WORLD ASKS:
Is Ethereum building a genuine recovery, or are buyers simply taking advantage of the recent sell-off?
🟢 Bullish recovery?
🔴 Another rejection?
⚖️ More consolidation?
Share your reasoning. Let's discuss the charts, not just the candles.
🌍 Welcome to the CashCalling™ Trading World.
CashCalling™ | Levels, not slogans.