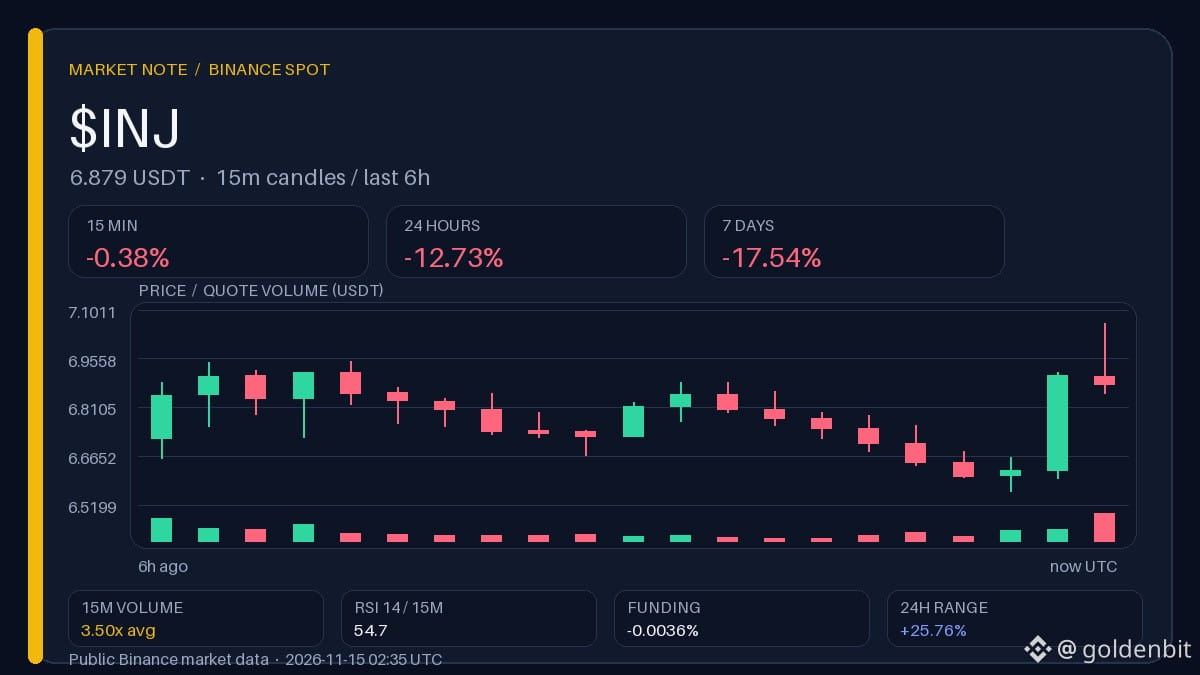
$INJ: volume ×3.5 on the 15-minute chart doesn’t cancel out the weekly decline
The volume spike here is more likely a consequence of a bounce off the lower boundary than a reversal of weekly pressure. The price fell 12.73% in 24 hours and 17.54% over 7 days, while funding remains negative: −0.0036%.
Observation range · 5 h
Above 7.0610: Holding above the upper boundary of the local range would support the case for a shift in short-term momentum.
Below 6.5600: A return to the lower boundary would strengthen the interpretation of the spike as a bounce within a weekly decline.
These are historical levels; a single wick does not confirm the scenario.
↩️ Result from the previous “Contrast Radar” edition (14.11 02:15 UTC): INJ 7.9900 → 7.6430 USDT (−4.34% over 12 h), funding +0.010% → +0.010%.
What would need to change in funding for the volume spike to stop looking like a reaction to the drop?
Binance data, snapshot at 02:35 UTC. The author may receive a reward through Binance Square Write to Earn.
The volume spike here is more likely a consequence of a bounce off the lower boundary than a reversal of weekly pressure. The price fell 12.73% in 24 hours and 17.54% over 7 days, while funding remains negative: −0.0036%.
Observation range · 5 h
Above 7.0610: Holding above the upper boundary of the local range would support the case for a shift in short-term momentum.
Below 6.5600: A return to the lower boundary would strengthen the interpretation of the spike as a bounce within a weekly decline.
These are historical levels; a single wick does not confirm the scenario.
↩️ Result from the previous “Contrast Radar” edition (14.11 02:15 UTC): INJ 7.9900 → 7.6430 USDT (−4.34% over 12 h), funding +0.010% → +0.010%.
What would need to change in funding for the volume spike to stop looking like a reaction to the drop?
Binance data, snapshot at 02:35 UTC. The author may receive a reward through Binance Square Write to Earn.