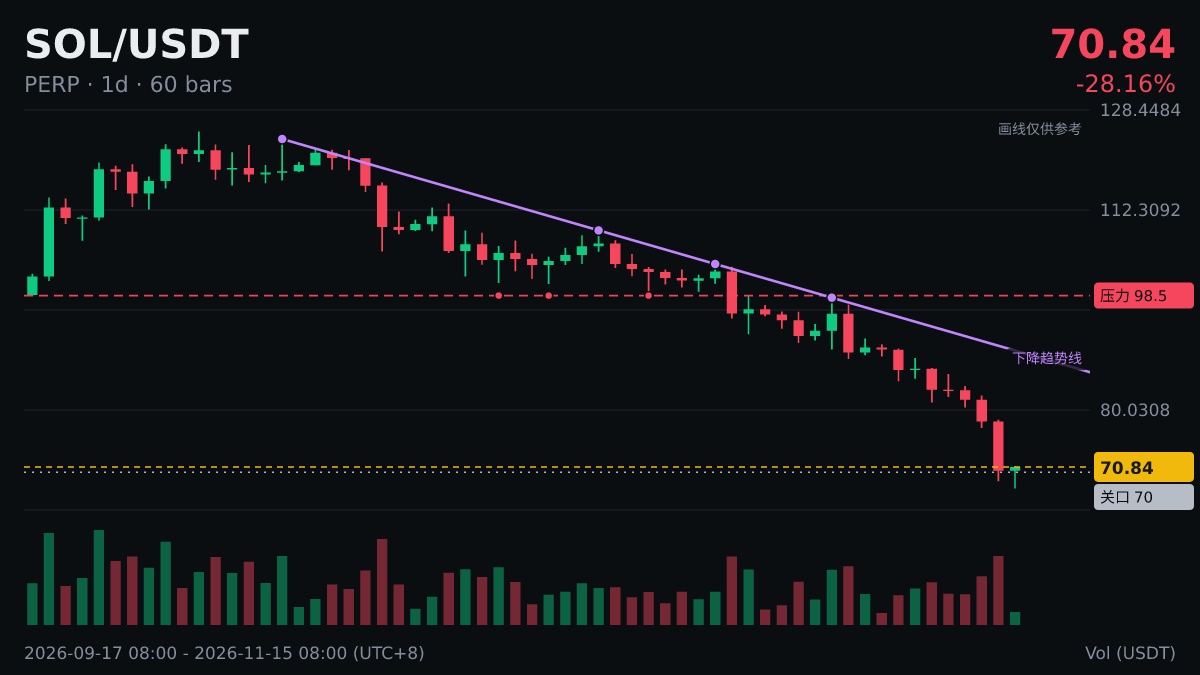
$SOL The daily chart has had 5 consecutive bearish candles, down a total of 18.99% during that period. Today, it's up 0.74% so far.
Let's use this figure to break down consecutive bullish and bearish candles.
Consecutive bullish candles on a daily chart are different from runs of same-colored hourly candles: each daily candle represents a full day's battle between buyers and sellers, so several consecutive candles of the same color are rarer on a daily chart.
There is no set duration for a bullish or bearish streak. Some last many days, while others reverse after just a few. The number of days alone can't tell you what will happen next.
Extreme readings often come with greater volatility. At times like these, it's better to reduce leverage rather than increase your position.
#SOL
This could be wrong too, so don't blindly follow it.
Let's use this figure to break down consecutive bullish and bearish candles.
Consecutive bullish candles on a daily chart are different from runs of same-colored hourly candles: each daily candle represents a full day's battle between buyers and sellers, so several consecutive candles of the same color are rarer on a daily chart.
There is no set duration for a bullish or bearish streak. Some last many days, while others reverse after just a few. The number of days alone can't tell you what will happen next.
Extreme readings often come with greater volatility. At times like these, it's better to reduce leverage rather than increase your position.
#SOL
This could be wrong too, so don't blindly follow it.