LTC printed a lower wick—is that proof someone “bought the dip”?
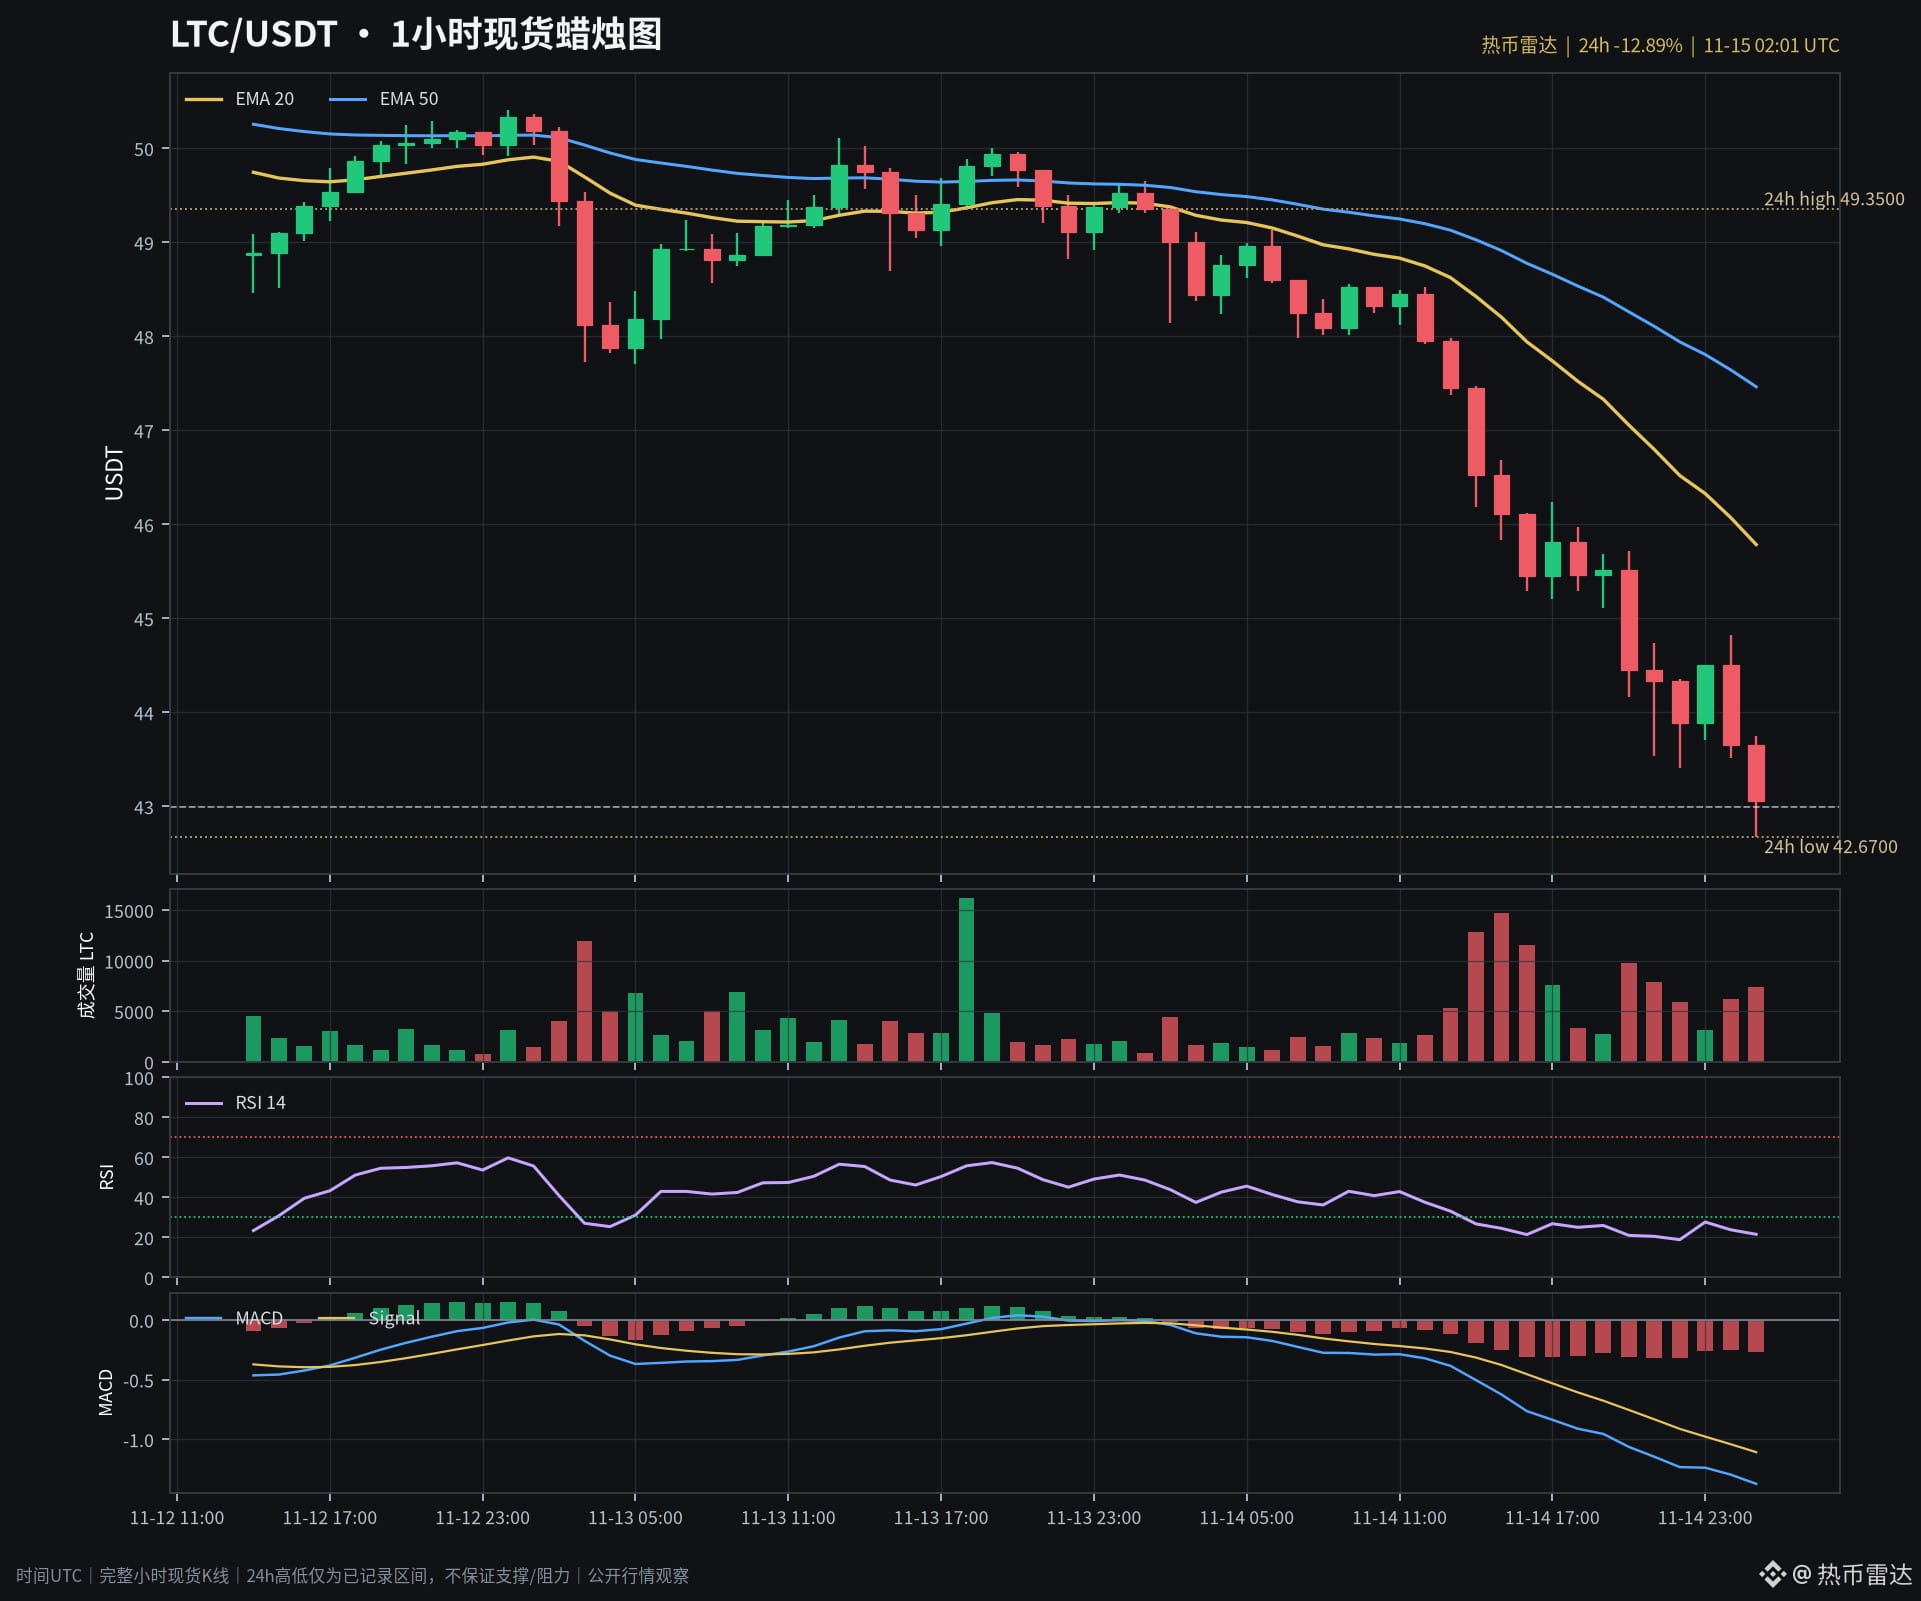
Full hourly candle for Nov. 15, 01:00–02:00 UTC: opened at 43.65, hit a low of 42.67, and closed at 43.06, still down 1.35%. Volume was about 7,438 LTC, up 20% from the previous hour. There was a rebound, but volume was also higher; that alone isn’t enough to conclude that funds are accumulating.
At 02:01 UTC, spot was around 42.99, down 12.89% over 24 hours. The hourly RSI was about 21.5, while the MACD remained below its signal line. Oversold conditions have yet to turn into a structural recovery.
First watch whether a full hourly candle can close back above its open at 43.65, then retest without breaking below it. If the price falls below 42.67 again and fails to recover, the interpretation that the lower wick signals stabilization is invalidated. 42.67 is only a recorded low, not guaranteed support.
The chart shows the spot 1-hour candlestick chart; LTCUSDT Perp is a separate perpetual market card, and the coin label links to spot. For market observation only; this is not a buy or sell recommendation.
$LTC
Full hourly candle for Nov. 15, 01:00–02:00 UTC: opened at 43.65, hit a low of 42.67, and closed at 43.06, still down 1.35%. Volume was about 7,438 LTC, up 20% from the previous hour. There was a rebound, but volume was also higher; that alone isn’t enough to conclude that funds are accumulating.
At 02:01 UTC, spot was around 42.99, down 12.89% over 24 hours. The hourly RSI was about 21.5, while the MACD remained below its signal line. Oversold conditions have yet to turn into a structural recovery.
First watch whether a full hourly candle can close back above its open at 43.65, then retest without breaking below it. If the price falls below 42.67 again and fails to recover, the interpretation that the lower wick signals stabilization is invalidated. 42.67 is only a recorded low, not guaranteed support.
The chart shows the spot 1-hour candlestick chart; LTCUSDT Perp is a separate perpetual market card, and the coin label links to spot. For market observation only; this is not a buy or sell recommendation.
$LTC