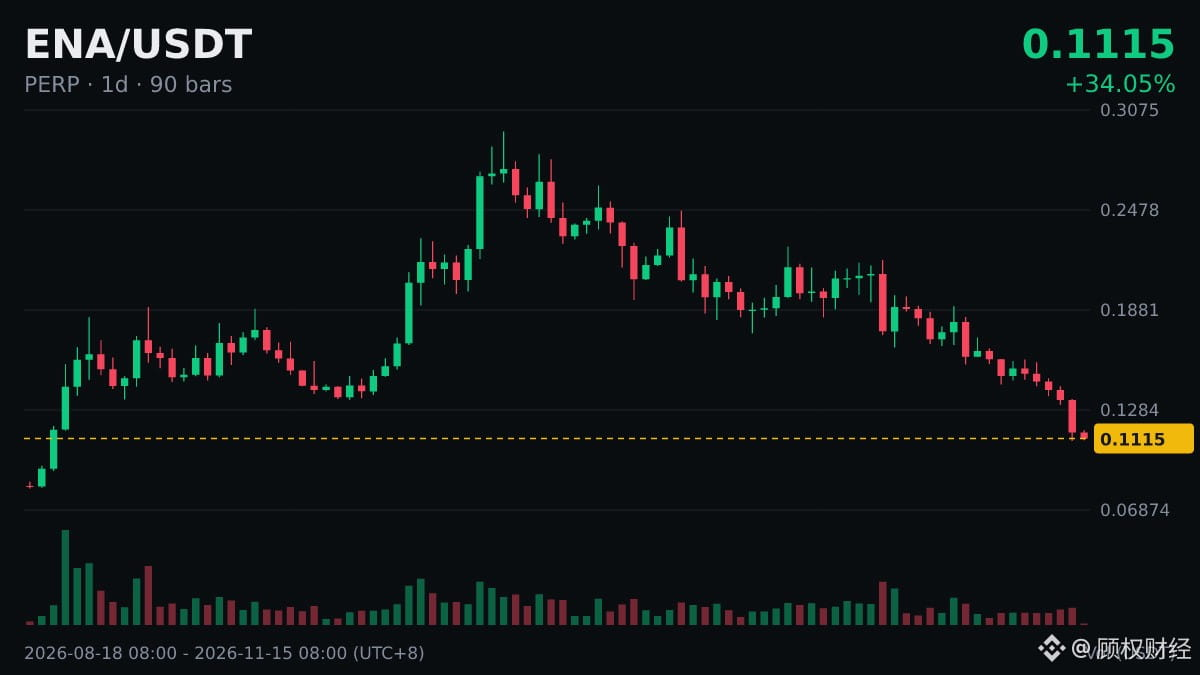
Chart Notes|$ENA |Daily RSI(14) 25|Oversold
Definition: The 14 in RSI means 14 candlesticks: on a 4-hour chart, that corresponds to a little over two days (56 hours); on a daily chart, it’s exactly two weeks.
Common interpretation: During a one-way uptrend, RSI can stay above 70 for a long time; during a sustained decline, it can also remain below 30 for a long time. Overbought or oversold conditions don’t mean an immediate reversal.
The point of understanding an indicator is to avoid being intimidated by the numbers, not to use it to predict tops and bottoms.
Definition: The 14 in RSI means 14 candlesticks: on a 4-hour chart, that corresponds to a little over two days (56 hours); on a daily chart, it’s exactly two weeks.
Common interpretation: During a one-way uptrend, RSI can stay above 70 for a long time; during a sustained decline, it can also remain below 30 for a long time. Overbought or oversold conditions don’t mean an immediate reversal.
The point of understanding an indicator is to avoid being intimidated by the numbers, not to use it to predict tops and bottoms.