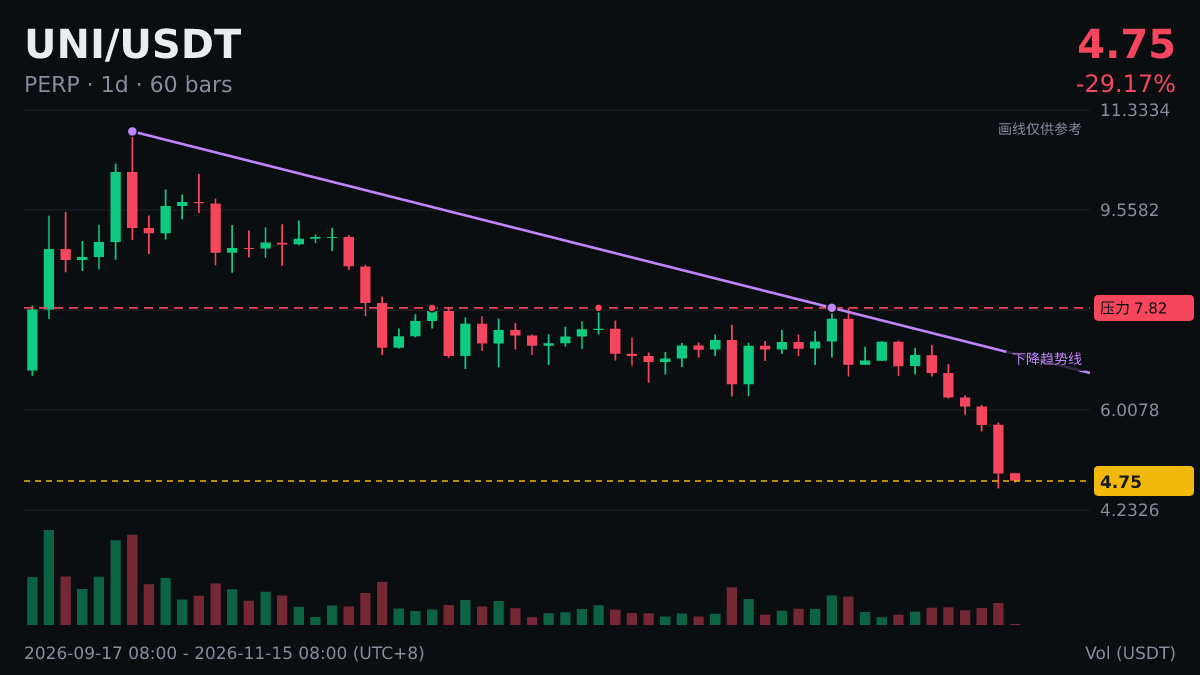
$UNI The daily chart has had 5 consecutive down days, with a cumulative decline of -30.05% during that period. So far today, it’s down -3.3%.
A one-minute explainer: What do consecutive down days mean?
A bullish candle compares that day’s opening and closing prices. Binance trades around the clock, so the daily candle’s opening price is almost the same as the previous day’s closing price. That means a bullish candle generally indicates a rise from the previous day’s close.
Some people compare daily and weekly charts: when the weekly trend is moving in the same direction, a streak of bullish or bearish daily candles is more likely to continue for a while; when the trends oppose each other, it’s worth being more cautious.
Comparing several indicators is more reliable than looking at just one, but even multiple indicators can’t provide a definite conclusion.
This is not investment advice. Don’t follow it.
A one-minute explainer: What do consecutive down days mean?
A bullish candle compares that day’s opening and closing prices. Binance trades around the clock, so the daily candle’s opening price is almost the same as the previous day’s closing price. That means a bullish candle generally indicates a rise from the previous day’s close.
Some people compare daily and weekly charts: when the weekly trend is moving in the same direction, a streak of bullish or bearish daily candles is more likely to continue for a while; when the trends oppose each other, it’s worth being more cautious.
Comparing several indicators is more reliable than looking at just one, but even multiple indicators can’t provide a definite conclusion.
This is not investment advice. Don’t follow it.