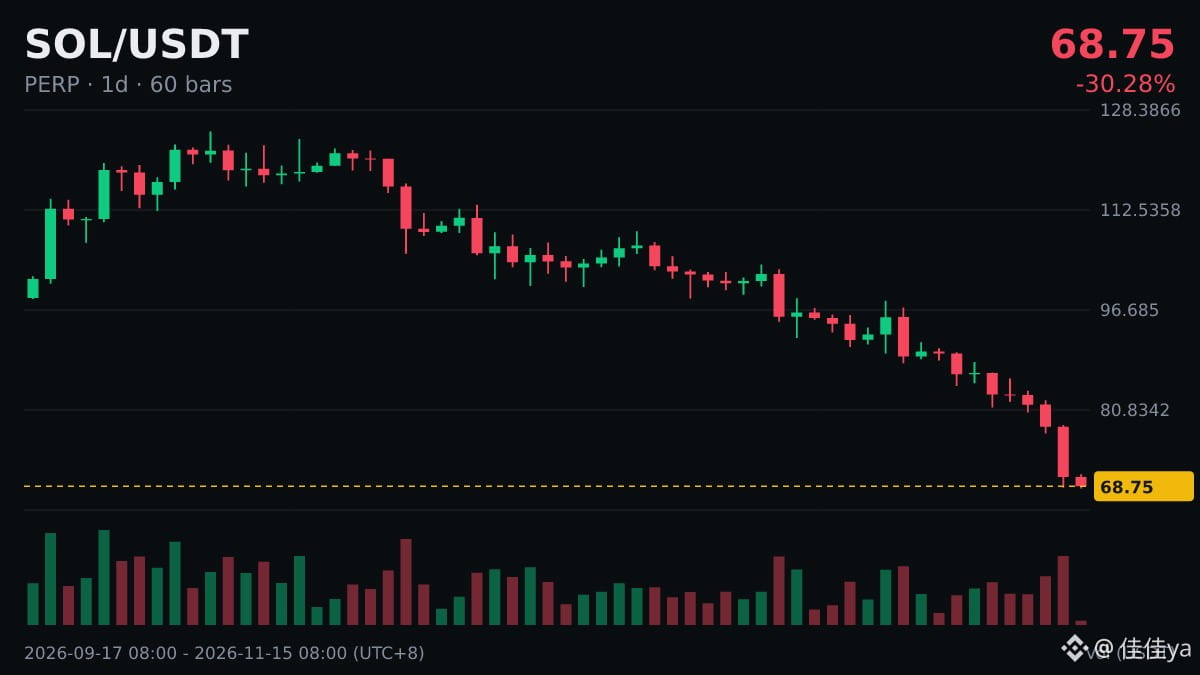
$SOL daily candles have closed lower for 5 days in a row, down a total of 18.99% over that period, and down 2.34% so far today.
Hey everyone, what does it mean when prices rise or fall for several days in a row? Here’s the short version 👇
Consecutive up or down days on the daily chart mean something different from a series of consecutive hourly candles: each daily candle represents a full day of buying and selling, so several candles of the same color in a row are less common on the daily chart.
A candle of the opposite color after a run of consecutive up or down days doesn’t necessarily mean the trend has reversed; in many cases, it’s just a pullback.
Don’t let a single number throw off your original plan, and never gamble on a prediction with borrowed money.
This is only an opinion, not necessarily a correct one. Please manage your own risk.
Hey everyone, what does it mean when prices rise or fall for several days in a row? Here’s the short version 👇
Consecutive up or down days on the daily chart mean something different from a series of consecutive hourly candles: each daily candle represents a full day of buying and selling, so several candles of the same color in a row are less common on the daily chart.
A candle of the opposite color after a run of consecutive up or down days doesn’t necessarily mean the trend has reversed; in many cases, it’s just a pullback.
Don’t let a single number throw off your original plan, and never gamble on a prediction with borrowed money.
This is only an opinion, not necessarily a correct one. Please manage your own risk.