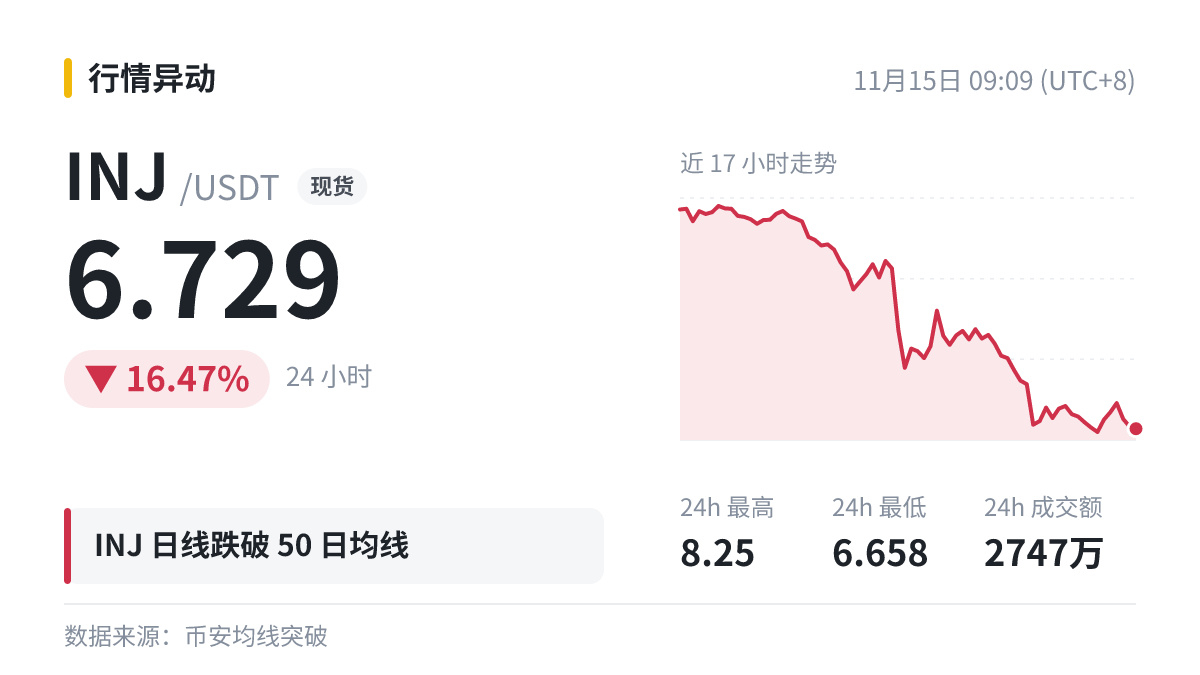
$INJ breaks below MA50 (7.7894) on the daily chart, down 16.47% over 24h.
Let’s use this figure to break down moving averages.
Moving averages fall into two categories: simple and exponential. Here, MA usually refers to a simple moving average, where each candlestick is weighted equally; EMA gives more weight to recent prices.
When the price moves too far from a long-term moving average, it’s often thought likely to move back toward it. However, when the trend is strong, the deviation can persist for a long time.
Indicators may be inaccurate, so risk management should never be overlooked: deciding in advance what to do if you’re wrong matters more than getting the prediction right.
Let’s use this figure to break down moving averages.
Moving averages fall into two categories: simple and exponential. Here, MA usually refers to a simple moving average, where each candlestick is weighted equally; EMA gives more weight to recent prices.
When the price moves too far from a long-term moving average, it’s often thought likely to move back toward it. However, when the trend is strong, the deviation can persist for a long time.
Indicators may be inaccurate, so risk management should never be overlooked: deciding in advance what to do if you’re wrong matters more than getting the prediction right.