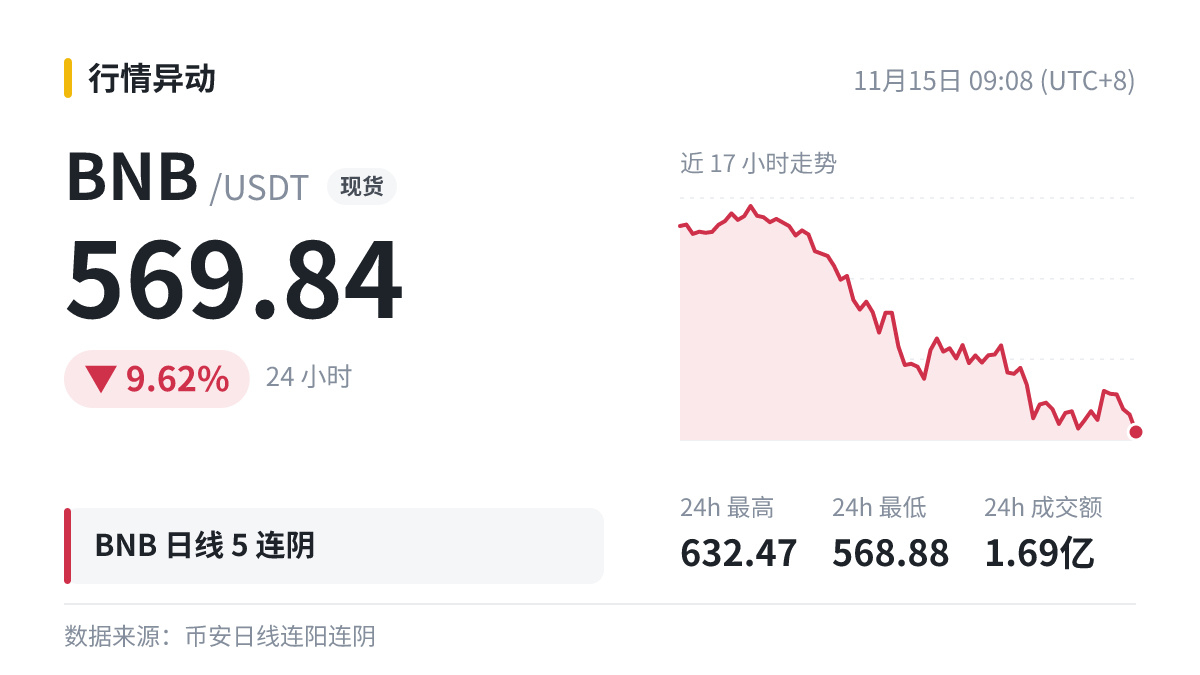
$BNB Five consecutive bearish daily candles, down a cumulative 15.87% over the period, and down 2.11% so far today.
Let’s use this figure to talk about consecutive bearish daily candles.
A run of candlesticks in the same color means one side has continued to dominate over those days, suggesting a fairly clear direction on the chart.
But consecutive daily candles of the same color can also occur in a sideways range: several daily candles may all be bullish or bearish despite only small price moves, with little overall change. In that case, the consecutive run has limited significance.
The same reading can mean completely different things in different market conditions, so don’t apply a rule of thumb mechanically.
Let’s use this figure to talk about consecutive bearish daily candles.
A run of candlesticks in the same color means one side has continued to dominate over those days, suggesting a fairly clear direction on the chart.
But consecutive daily candles of the same color can also occur in a sideways range: several daily candles may all be bullish or bearish despite only small price moves, with little overall change. In that case, the consecutive run has limited significance.
The same reading can mean completely different things in different market conditions, so don’t apply a rule of thumb mechanically.