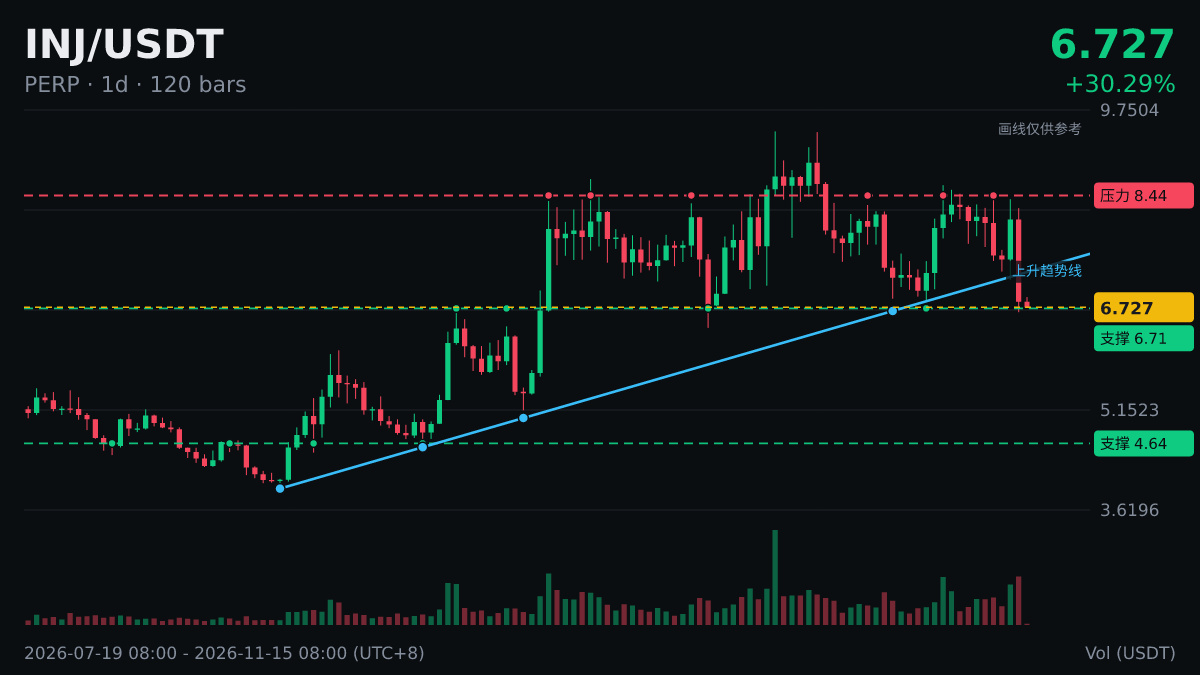
Data at a glance: $INJ |Daily chart breaks below MA50|MA50 7.7894
What it is: MA200 is the average closing price over the most recent 200 days on the daily chart. It’s often used as a reference for bull and bear trends; MA50 is commonly used to gauge the medium-term trend.
How to read it: A moving average is simply a line calculated from an average. It has no magic of its own. It’s often considered important because so many people are watching it.
Indicators may be inaccurate, so don’t skip your stop-loss: thinking in advance about what you’ll do if you’re wrong matters more than predicting whether you’ll be right.
The signal is posted just once. Once it scrolls by, it’s gone—follow first, and wait for the wind to pick up.
What it is: MA200 is the average closing price over the most recent 200 days on the daily chart. It’s often used as a reference for bull and bear trends; MA50 is commonly used to gauge the medium-term trend.
How to read it: A moving average is simply a line calculated from an average. It has no magic of its own. It’s often considered important because so many people are watching it.
Indicators may be inaccurate, so don’t skip your stop-loss: thinking in advance about what you’ll do if you’re wrong matters more than predicting whether you’ll be right.
The signal is posted just once. Once it scrolls by, it’s gone—follow first, and wait for the wind to pick up.