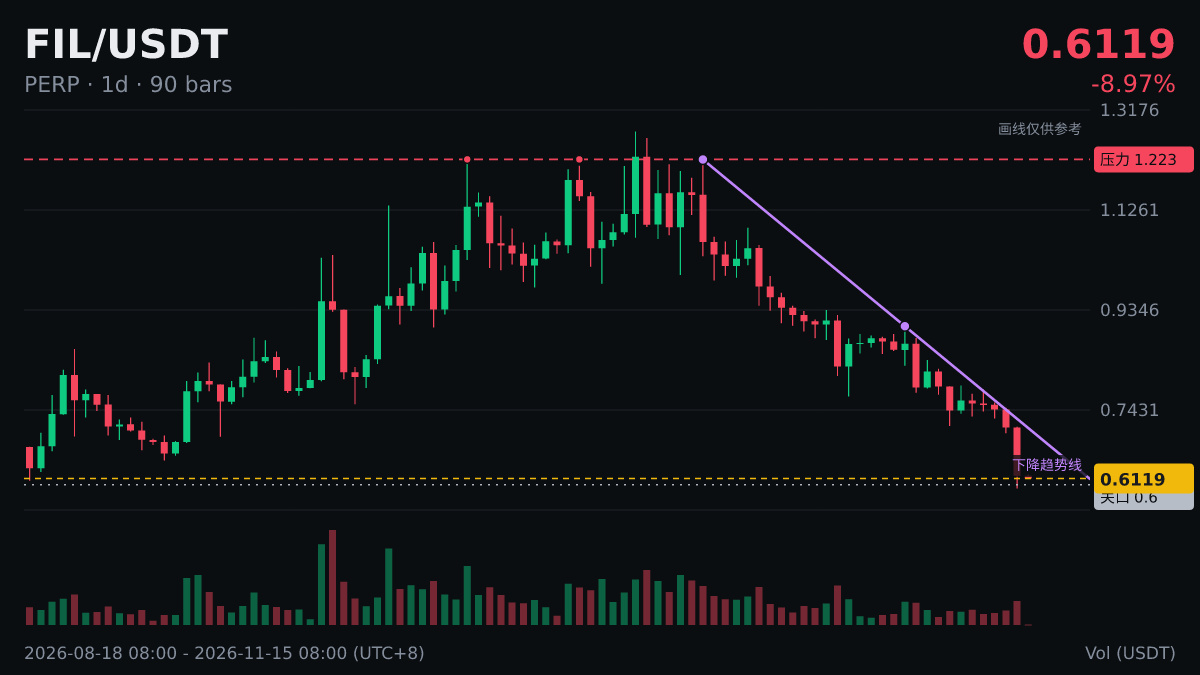
Chart Notes|$FIL |Daily RSI(14) 23.7|Oversold
Definition: RSI (Relative Strength Index) was introduced by Welles Wilder in 1978. It is calculated using the average gains and average losses over the most recent 14 candlesticks, and ranges from 0 to 100.
How to read it: RSI is calculated from historical prices and reflects the strength of past price movements; it cannot tell us what will happen next.
All indicators merely summarize past market action; prices can move in the opposite direction at any time.
Just sharing an opinion; this is not investment advice.
Definition: RSI (Relative Strength Index) was introduced by Welles Wilder in 1978. It is calculated using the average gains and average losses over the most recent 14 candlesticks, and ranges from 0 to 100.
How to read it: RSI is calculated from historical prices and reflects the strength of past price movements; it cannot tell us what will happen next.
All indicators merely summarize past market action; prices can move in the opposite direction at any time.
Just sharing an opinion; this is not investment advice.