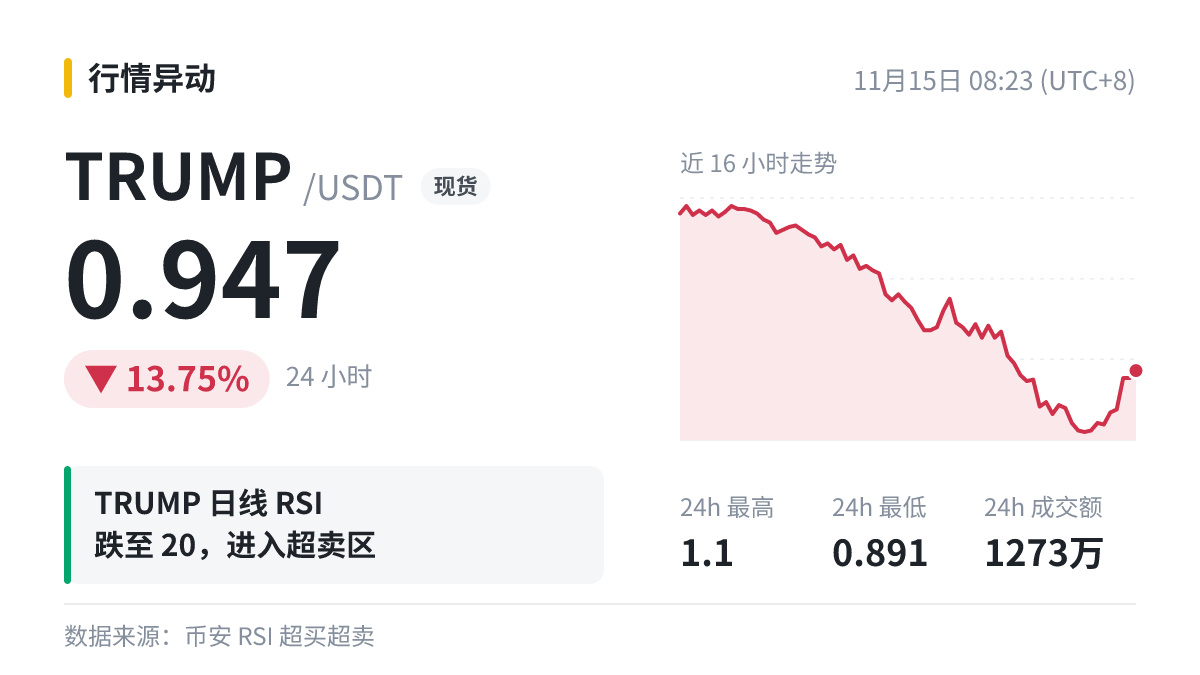
$TRUMP |Daily RSI(14) 20.2|Oversold
Before looking at money flows, first get to grips with RSI.
Put simply, RSI measures the proportion of recent price gains relative to the total magnitude of gains and losses: the stronger and larger the gains, the closer RSI gets to 100.
I generally use RSI as a signal that sentiment may be overheated or overly bearish, and consider it alongside key price levels and volume. I don’t rely on it alone to make decisions.
Comparing multiple indicators is more reliable than looking at just one, but even more signals can’t provide a definitive answer.
Before looking at money flows, first get to grips with RSI.
Put simply, RSI measures the proportion of recent price gains relative to the total magnitude of gains and losses: the stronger and larger the gains, the closer RSI gets to 100.
I generally use RSI as a signal that sentiment may be overheated or overly bearish, and consider it alongside key price levels and volume. I don’t rely on it alone to make decisions.
Comparing multiple indicators is more reliable than looking at just one, but even more signals can’t provide a definitive answer.