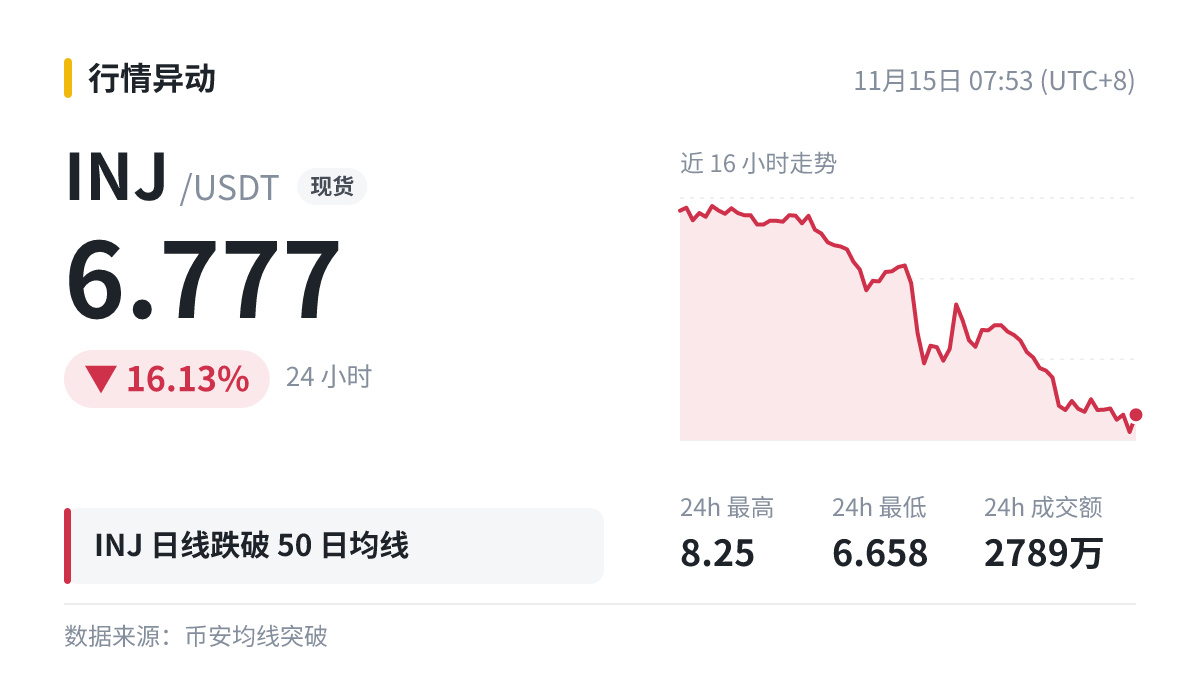
$INJ Daily price breaks below MA50 (7.7894).
A beginner asks the fundamental question: What is a moving average?
On the daily chart, MA200 is the average closing price over the most recent 200 days and is often used as a reference for the bull or bear trend; MA50 is often used to gauge the medium-term direction.
The same moving average can serve different purposes for different coins: the more actively traded a coin is and the more people are watching it, the more pronounced the fluctuations around its moving averages tend to be.
It’s much more reliable to determine your position size by working backward from where you’ll place your stop-loss than to just guess.
This isn’t financial advice. Make your own decisions.
A beginner asks the fundamental question: What is a moving average?
On the daily chart, MA200 is the average closing price over the most recent 200 days and is often used as a reference for the bull or bear trend; MA50 is often used to gauge the medium-term direction.
The same moving average can serve different purposes for different coins: the more actively traded a coin is and the more people are watching it, the more pronounced the fluctuations around its moving averages tend to be.
It’s much more reliable to determine your position size by working backward from where you’ll place your stop-loss than to just guess.
This isn’t financial advice. Make your own decisions.